Ministry of Finance
₹1,49,577 crore gross GST revenue collected in February 2023; 12% higher than GST revenues in same month last year
Monthly GST revenues more than Rs 1.4 lakh crore for 12 straight months in a row
Y-o-Y revenues from import of goods 6% higher and domestic transaction (including import of services) 15% higher
Posted On:
01 MAR 2023 2:36PM by PIB Delhi
The gross GST revenue collected in the month of February 2023 is ₹1,49,577 crore of which CGST is ₹27,662 crore, SGST is ₹34,915 crore, IGST is ₹75,069 crore (including ₹35,689 crore collected on import of goods) and Cess is ₹11,931 crore (including ₹792 crore collected on import of goods)
The government has settled ₹34,770 crore to CGST and ₹29,054 crore to SGST from IGST as regular settlement. The total revenue of Centre and the States after regular settlements in the month of February 2023 is ₹62,432 crore for CGST and ₹63,969 crore for the SGST. In addition, Centre had also released balance GST compensation of ₹16,982 crore for the month of June 2022 and ₹16,524 crore to States/UTs which have sent AG certified figures for previous period.
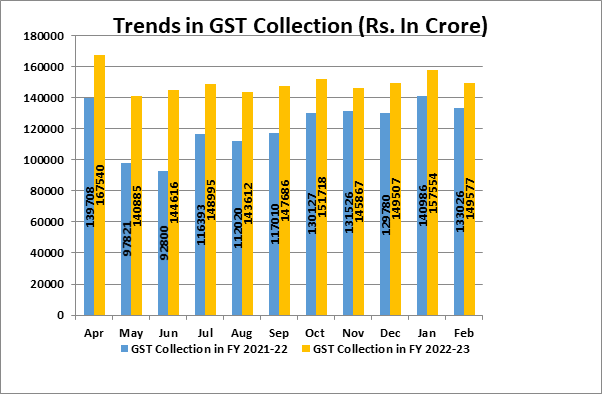
The revenues for the month of February 2023 are 12% higher than the GST revenues in the same month last year, which was Rs. 1,33,026 crore. During the month, revenues from import of goods was 6% higher and the revenues from domestic transaction (including import of services) are 15% higher than the revenues from these sources during the same month last year. This month witnessed the highest cess collection of ₹11,931 crore since implementation of GST. Normally, February being a 28 day month, witnesses a relatively lower collection of revenue.
The chart below shows trends in monthly gross GST revenues during the current year. The table shows the state-wise figures of GST collected in each State during the month of February 2023 as compared to February 2022.

State-wise growth of GST Revenues during February 2023[1]
|
State
|
Feb-22
|
Feb-23
|
Growth
|
|
Jammu and Kashmir
|
326
|
434
|
33%
|
|
Himachal Pradesh
|
657
|
691
|
5%
|
|
Punjab
|
1,480
|
1,651
|
12%
|
|
Chandigarh
|
178
|
188
|
5%
|
|
Uttarakhand
|
1,176
|
1,405
|
20%
|
|
Haryana
|
5,928
|
7,310
|
23%
|
|
Delhi
|
3,922
|
4,769
|
22%
|
|
Rajasthan
|
3,469
|
3,941
|
14%
|
|
Uttar Pradesh
|
6,519
|
7,431
|
14%
|
|
Bihar
|
1,206
|
1,499
|
24%
|
|
Sikkim
|
222
|
265
|
19%
|
|
Arunachal Pradesh
|
56
|
78
|
39%
|
|
Nagaland
|
33
|
54
|
64%
|
|
Manipur
|
39
|
64
|
64%
|
|
Mizoram
|
24
|
58
|
138%
|
|
Tripura
|
66
|
79
|
20%
|
|
Meghalaya
|
201
|
189
|
-6%
|
|
Assam
|
1,008
|
1,111
|
10%
|
|
West Bengal
|
4,414
|
4,955
|
12%
|
|
Jharkhand
|
2,536
|
2,962
|
17%
|
|
Odisha
|
4,101
|
4,519
|
10%
|
|
Chhattisgarh
|
2,783
|
3,009
|
8%
|
|
Madhya Pradesh
|
2,853
|
3,235
|
13%
|
|
Gujarat
|
8,873
|
9,574
|
8%
|
|
Dadra and Nagar Haveli
|
260
|
283
|
9%
|
|
Maharashtra
|
19,423
|
22,349
|
15%
|
|
Karnataka
|
9,176
|
10,809
|
18%
|
|
Goa
|
364
|
493
|
35%
|
|
Lakshadweep
|
1
|
3
|
274%
|
|
Kerala
|
2,074
|
2,326
|
12%
|
|
Tamil Nadu
|
7,393
|
8,774
|
19%
|
|
Puducherry
|
178
|
188
|
5%
|
|
Andaman and Nicobar Islands
|
22
|
31
|
40%
|
|
Telangana
|
4,113
|
4,424
|
8%
|
|
Andhra Pradesh
|
3,157
|
3,557
|
13%
|
|
Ladakh
|
16
|
24
|
56%
|
|
Other Territory
|
136
|
211
|
55%
|
|
Centre Jurisdiction
|
167
|
154
|
-8%
|
|
Total
|
98,550
|
1,13,096
|
15%
|
****
PPG/KMN
[1]Does not include GST on import of goods
(Release ID: 1903336)