Ministry of Commerce & Industry
Index Numbers of Wholesale Price in India (Base: 2011-12=100) for April, 2020
प्रविष्टि तिथि:
14 MAY 2020 11:55AM by PIB Delhi
The Office of Economic Adviser, Department for Promotion of Industry and Internal Trade is releasing Wholesale price Index (WPI) for the month of April, 2020.
In view of the limited transactions of products in the wholesale market in the month of April, 2020, due to spread of Covid-19 pandemic, it has been decided to release the Price Movement of selected Sub-groups/Groups of WPI, following the principles of adequacy. All Commodities WPI could not be computed for April-2020 due to non- availability of manufactured product group index.
The movement of the index and WPI based rate of inflation for the major commodity groups is summarized below:-
|
WPI based Indices and Annual Rate of Inflation (%)*
|
|
All Commodities/Major Groups
|
Weight (%)
|
Feb-20 (F)
|
Mar-20 (P)
|
Apr-20 (P)
|
|
Index
|
Inflation
|
Index
|
Inflation
|
Index
|
Inflation
|
|
All Commodities
|
100.00
|
122.2
|
2.26
|
121.1
|
1.00
|
-
|
-
|
|
I. Primary Articles
|
22.60
|
142.8
|
6.49
|
139.5
|
3.72
|
138.2
|
-0.79
|
|
II. Fuel & Power
|
13.20
|
103.6
|
3.08
|
100.7
|
-1.76
|
92.4
|
-10.12
|
|
III. Manufactured Products
|
64.20
|
118.8
|
0.51
|
118.7
|
0.34
|
-
|
-
|
|
WPI Food Index
|
24.40
|
148.1
|
7.24
|
146.1
|
5.49
|
146.6
|
3.60
|
Note: P: Provisional; F: Final, * Annual Rate of Inflation calculated over corresponding month of last year.
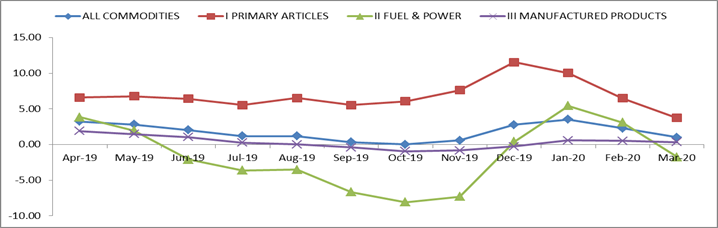
Annual Rate of Inflation(y-o-y in %) based on WPI (2011-12)
The price indices of Primary Articles have been computed based on mandi prices of agricultural items reported from Directorate of Economics & Statistics, M/o Agriculture; ex-mine prices of minerals reported from Indian Bureau of Mines; prices of crude petroleum & natural gas reported from Ministry of Petroleum and Natural Gas and selected PSUs. Price indices of Fuel & Power major group have been computed based on the price data reported from Ministry of Petroleum and Natural Gas, selected PSUs, Office of the Coal Controller and Central Electricity Authority. Price indices of these major groups (Primary Articles and Fuel & Power) were released for April 2020 with standard procedures. No changes in estimation procedures were done.
In view of the preventive measures and announcement of nation-wide lockdown by the Government to contain spread of COVID-19 pandemic, the price collection of Manufactured Products through personal visits of price collectors was suspended with effect from 19thMarch, 2020. The data (ex-factory prices) was collected through electronic means of communications from selected factories and institutional sources. The Price Movement of these Sub-groups/Groups of WPI was worked out by taking the prices of only those items for which at least 25% of price quotations were reported from the selected manufacturing units. Out of the 22 NIC two-digit groups for Manufactured products, based up the above criterion, indices were compiled only for 5 manufacturing groups i.e, manufacture of food products, manufacture of beverages, manufacture of chemicals and chemical products, manufacture of pharmaceuticals, medicinal chemical and botanical products, and manufacture of Basic Metals.
PRIMARY ARTICLES (Weight 22.62%)
The index for this major group declined in April 20by (-0.9%) to 138.2 (P) from 139.5 (P) for the previous month.Prices of Minerals (2.3%), Food Articles (0.7%) and Non Food Articles (0.1%) increased whereas prices of Crude Petroleum & Natural Gas (-24.7%) declined as compared to the previous month.
FUEL & POWER (Weight 13.15%)
The index for this major group declined in April 20 by (-8.2 %) to 92.4 (P) from 100.7(P) for the previous month. Prices of mineral oils group (-14.11%) and electricity (-3.39%) declined whereas prices of coal remained unchanged as compared to the previous month.
MANUFACTURED PRODUCTS (Weight 64.23%)
In view of the limited transactions of products in the market in the month of April, 2020, it has been decided to release only limited numbers of major groups/sub-groups of manufactured products. Prices of Manufacture of Food Products (-0.29%), Manufacture of Pharmaceuticals, medicinal chemical and botanical products (-0.15%) and Manufacture of Basic metals (-0.84%)provisionally declined whereas prices of Manufacture of Chemicals and Chemical Products (0.86%) and Manufacture of Beverages (0.24%) provisionally increased in April 20 compared to the previous month.
WPI FOOD INDEX (Weight 24.38%)
The Food Index consisting of ‘Food Articles’ from Primary Articles group and ‘Food Products’ from Manufactured Products group have provisionally increased from 146.1 in March, 2020 to 146.6 in April, 2020.The rate of inflation based on WPI Food Index decreased from 5.49% in March, 2020 to 3.60% in April, 2020.
FINAL INDEX FOR THE MONTH OF FEBRUARY, 2020 (BASE YEAR:2011-12=100)
For the month of February, 2020 the final Wholesale Price Index and WPI based inflation rate for 'All Commodities' (Base: 2011-12=100) remained unchanged at 122.2 and 2.26% respectively as reported on 14.02.2020.
Next date of press release: 15/06/2020 for the month of May, 2020
Office of Economic Adviser, Ministry of Commerce & Industry, New Delhi,
This press release, item indices, and inflation numbers are available at our home page http://eaindustry.nic.in
All India Wholesale Price Indices and Rates of Inflation (Base Year: 2011-12=100) for April 2020Annexure-I
|
Commodities/Major Groups/Groups/Sub-Groups/Items
|
Weight
|
Index (Latest Month)
|
Latest month over month
|
Year on year
|
|
2019-2020
|
2020-2021
|
2019-2020
|
2020-2021
|
|
ALL COMMODITIES
|
100.0
|
--
|
1.00
|
--
|
3.24
|
--
|
|
I. PRIMARY ARTICLES
|
22.62
|
138.2
|
3.57
|
-0.93
|
6.58
|
-0.79
|
|
Food Articles
|
15.26
|
152.6
|
2.98
|
0.66
|
6.44
|
2.55
|
|
Cereals
|
2.82
|
161.3
|
-0.32
|
-0.25
|
8.43
|
2.74
|
|
Paddy
|
1.43
|
159.2
|
0.26
|
-0.06
|
2.41
|
1.40
|
|
Wheat
|
1.03
|
162.5
|
-2.57
|
-0.25
|
7.52
|
7.26
|
|
Pulses
|
0.64
|
155.1
|
2.07
|
2.24
|
14.32
|
12.31
|
|
Vegetables
|
1.87
|
165.8
|
13.51
|
3.69
|
31.34
|
2.22
|
|
Potato
|
0.28
|
228.1
|
6.95
|
5.36
|
-16.22
|
59.40
|
|
Onion
|
0.16
|
205.8
|
9.81
|
-10.25
|
-3.26
|
73.52
|
|
Fruits
|
1.60
|
151.6
|
9.75
|
8.36
|
-6.88
|
-1.69
|
|
Milk
|
4.44
|
151.6
|
0.00
|
0.46
|
1.42
|
5.87
|
|
Eggs, Meat & Fish
|
2.40
|
140.5
|
1.42
|
-4.29
|
7.85
|
-1.68
|
|
Non-Food Articles
|
4.12
|
126.2
|
3.23
|
0.08
|
6.06
|
-1.17
|
|
Oil Seeds
|
1.12
|
150.0
|
1.58
|
0.07
|
6.79
|
1.49
|
|
Minerals
|
0.83
|
157.4
|
14.49
|
2.34
|
12.70
|
-0.38
|
|
Crude Petroleum
|
1.95
|
47.9
|
4.71
|
-31.18
|
2.11
|
-41.73
|
|
II. FUEL & POWER
|
13.15
|
92.4
|
0.29
|
-8.24
|
3.84
|
-10.12
|
|
LPG
|
0.64
|
89.4
|
4.77
|
-6.97
|
11.11
|
-0.67
|
|
Petrol
|
1.60
|
75.0
|
2.09
|
-7.41
|
1.86
|
-14.58
|
|
HSD
|
3.10
|
80.8
|
-1.24
|
-7.13
|
3.24
|
-15.39
|
|
III. MANUFACTURED PRODUCTS
|
64.23
|
--
|
0.17
|
--
|
1.89
|
--
|
|
Mf/o Food Products1
|
9.12
|
136.5
|
0.78
|
-0.29
|
1.17
|
5.49
|
|
Vegetable And Animal Oils and Fats
|
2.64
|
127.6
|
0.18
|
-0.62
|
-4.45
|
12.03
|
|
Mf/o Beverages
|
0.91
|
124.4
|
0.57
|
0.24
|
2.94
|
1.39
|
|
Mf/o Tobacco Products
|
0.51
|
--
|
-0.39
|
--
|
3.23
|
--
|
|
Mf/o Textiles
|
4.88
|
--
|
0.67
|
--
|
3.92
|
--
|
|
Mf/o Wearing Apparel
|
0.81
|
--
|
0.51
|
--
|
-1.07
|
--
|
|
Mf/o Leather and Related Products
|
0.54
|
--
|
0.00
|
--
|
-1.63
|
--
|
|
Mf/o Wood And of Products of Wood and Cork
|
0.77
|
--
|
-1.11
|
--
|
1.21
|
--
|
|
Mf/o Paper and Paper Products
|
1.11
|
--
|
0.08
|
--
|
2.57
|
--
|
|
Mf/o Chemicals and Chemical Products2
|
6.47
|
116.8
|
0.25
|
0.86
|
3.10
|
-2.59
|
|
Mf/o Pharmaceuticals, Medicinal Chemical And Botanical Products
|
1.99
|
130.4
|
-1.03
|
-0.15
|
4.08
|
4.24
|
|
Mf/o Rubber and Plastics Products
|
2.30
|
--
|
-0.36
|
--
|
1.11
|
--
|
|
Mf/o other Non-Metallic Mineral Products
|
3.20
|
--
|
0.69
|
--
|
1.73
|
--
|
|
Cement, Lime and Plaster
|
1.64
|
|
2.22
|
|
4.62
|
|
|
Mf/o Basic Metals3
|
9.65
|
105.7
|
-0.54
|
-0.84
|
0.09
|
-4.34
|
|
Mild Steel - Semi Finished Steel
|
1.27
|
--
|
-0.10
|
|
-0.81
|
|
|
Mf/o Fabricated Metal Products, Except Machinery and Equipment
|
3.15
|
--
|
0.00
|
|
4.75
|
|
Note:
1- Index for Mf/o Food Products is computed excluding sub-groups viz. ‘Processing and preserving of meat’ and ‘Manufacture of processed ready to eat food’. The weights of these subgroups are distributed among other subgroups on pro rata basis.
2- Index for Mf/o Chemicals and Chemical Products is compiled excluding the subgroups manufacture of man-made fibres’ and ‘manufacture of paints, varnishes and similar coatings, printing ink and mastics’. The weights of these subgroups are distributed among other subgroups on pro rata basis
3. Index for Mf/o Basic Metals is computed excluding subgroup Forgings of steel. The weights of this subgroup is distributed among other subgroups on pro rata basis.
YB
(रिलीज़ आईडी: 1623753)
आगंतुक पटल : 9779