Ministry of Finance
Access to “The Bare Necessities” Such as Housing, Water, Sanitation, Electricity and Clean Cooking Fuel are a Sine Qua Non to live a Decent Life: Economic Survey
Economic Survey Examines the Progress Made in Providing Access to the “Bare Necessities” by Constructing a Bare Necessities Index (BNI)
Compared to 2012 Access to “The Bare Necessities” has Improved, Interstate Disparities have Declined, Access Improved Disproportionately more for the Poorest Households
Various Government Initiatives like Swachh Bharat Mission, Jal Jeevan Mission, Pradhan Mantri Awas Yojana, Saubhagya and Ujjwala Yojana have Improved Access to Bare Necessities Thus Leading to Improvement in Health and Education Indicators
Posted On:
29 JAN 2021 3:38PM by PIB Delhi
Economic Survey 2020-21 underlined the importance of access to bare necessities of housing, water, sanitation, electricity and clean cooking fuel which are consumed by all the members of the household and which touch the life of every member.
The Union minister for Finance and Corporate Affairs, Smt Nirmala Sitharaman presented the Economic Survey 2020-21 in Parliament today.
Economic Survey 2020-21 constructs a Bare Necessities Index (BNI) at the rural, urban and all India level. The BNI summarises 26 indicators on five dimensions viz., water, sanitation, housing, micro-environment, and other facilities. The BNI has been created for all States for 2012 and 2018 using data from two NSO rounds viz., 69th and 76th on Drinking Water, Sanitation, Hygiene and Housing Condition in India.

Economic Survey says that the “basic needs” approach to economic development focuses on minimum specified quantities of basic necessities such as food, clothing, shelter, water and sanitation that are necessary to prevent ill health and under nourishment. The Bare Necessities Index (BNI) is an attempt to quantify this approach to economic development using data from National Statistical Office (NSO). It is created for all States/Union Territories by employing data at State Level.
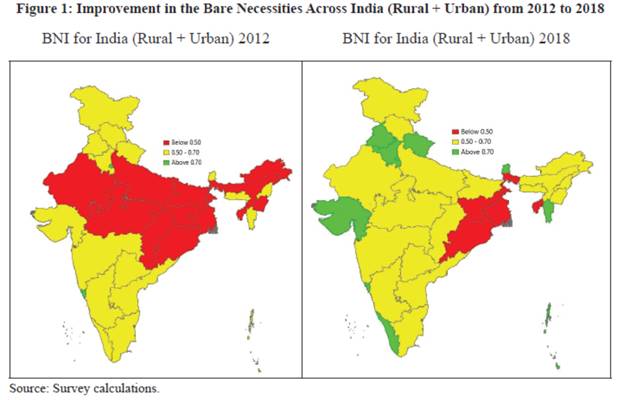
State-wise values of BNI in 2012 and 2018 for India (rural + urban), are shown in Figures 1. A higher value indicates better access to bare necessities in a State. The three colours, green, yellow and red, used in the maps show the level of a State in providing access to bare necessities to its households. Green (above 0.70) indicates ‘High’ level and is therefore the most desirable, followed by yellow (0.50 to 0.70), which indicates ‘Medium’ level. In contrast, Red (below 0.50) indicates very ‘Low’ level of access. The difference in colours in a map indicate the regional variation in the access to bare necessities for the households.

From the above figure of the Economic Survey it is quite evident that in most of the States the access to the Bare Necessities for the household in 2018 is significantly better compared to 2012.
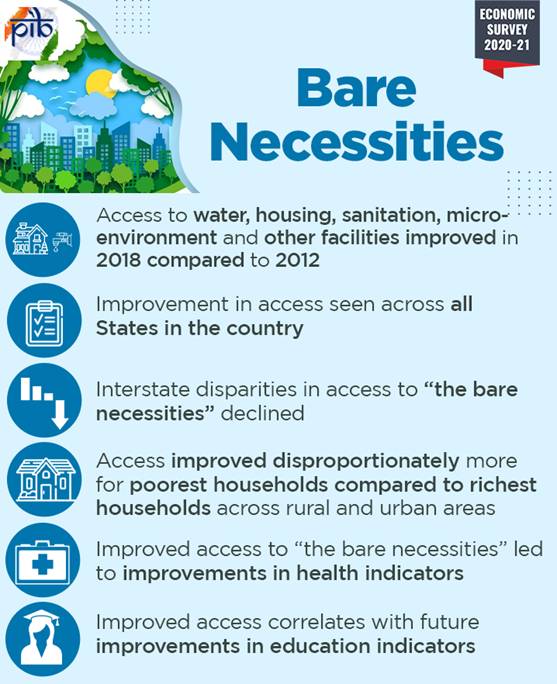
Economic Survey also underlines that due to the constant efforts made by the Government through network of schemes like Swachh Bharat Mission, National Rural Drinking Water Programme, Pradhan Mantri Awas Yojana, Saubhagya and Ujjwala Yojana access to bare necessities have improved in 2018 across all States in the country compared to 2012. Inter-State disparities in the access to the bare necessities have declined and access has improved disproportionately for the poorest household when compared to the richest household across rural and urban areas.
Improvements across various dimensions
- According to the survey access to drinking water to households in most of the States has improved in 2018 compared to 2012 in rural as well as urban areas.
- Survey also shows that the sanitation access has improved for all States in rural areas and for most of the States in urban areas in 2018 compared to 2012. It also notes that regional disparity in access to sanitation has declined as the States having low access to sanitation in 2012 have gained more. The level of access to safe sanitation has increased in lowest income quintile.
- Survey observes improvement in Housing Index also indicating improvement in access to housing and reduction in inter-States disparities with disproportionate benefits for the lowest income group in 2018 vis-à-vis 2012.
- The economic Survey also notes improvement in micro environment for all States in 2018 except for Assam in rural and Odisha and Assam in urban areas as compared to 2012. Here also the improvement is especially in the lowest income quintile.
- Similarly Survey has observed improvement in access to other facilities which captures the availability of Kitchen, Kitchen with a water tap, good ventilation in house, access to bathroom, electricity use and type of fuel used for cooking.
Improved health and education outcomes
Survey also points to a positive correlation between access to bare necessities and better health and education outcome, it observes improvement in child survival, decline in still births, malnutrition, and infant mortality with improved access to sanitation and clean drinking water.
Further electrification and access to toilets in schools has also increased educational outcome, says the Economic Survey.
***
RM/APS/JK
(Release ID: 1693202)
Visitor Counter : 11356