Ministry of Statistics & Programme Implementation
SECOND ADVANCE ESTIMATES OF ANNUAL GROSS DOMESTIC PRODUCT FOR 2024-25, QUARTERLY ESTIMATES OF GROSS DOMESTIC PRODUCT FOR THE THIRD QUARTER (OCTOBER-DECEMBER) OF 2024-25 AND FIRST REVISED & FINAL ESTIMATES OF GROSS DOMESTIC PRODUCT, NATIONAL INCOME, CONSUMPTION EXPENDITURE, SAVING AND CAPITAL FORMATION FOR 2023-24 & 2022-23 RESPECTIVELY
Real GDP Growth Rate of 9.2% for 2023-24 is the highest in the previous 12 years except for 2021-22
Growth Rate of Real GDP for 2024-25 is estimated as 6.5%
Real GDP has observed a Growth Rate of 6.2% in Q3 of FY 2024-25
Posted On:
28 FEB 2025 4:00PM by PIB Delhi
The National Statistics Office (NSO), Ministry of Statistics and Programme Implementation (MoSPI) is releasing in this Press Note the Second Advance Estimates (SAE) of Annual Gross Domestic Product (GDP) for Financial Year (FY) 2024-25; Quarterly Estimates of GDP for October-December Quarter (Q3) of FY 2024-25 along with its expenditure components and following Revised Estimates of GDP, National Income, Consumption Expenditure, Saving and Capital Formation:
a. First Revised Estimates (FRE) for the Financial year 2023-24;
b. Second Revised Estimates or Final Estimates (FE) for the Financial year 2022-23.
These estimates are released both at Constant (2011-12) and Current Prices, in accordance with the release calendar of National Accounts. Detailed Notes on: (i) Second Advance Estimates (SAE) of Annual Gross Domestic Product (GDP) of FY 2024-25, Quarterly Estimates of GDP for October-December Quarter (Q3) of FY 2024-25 and (ii) Abovementioned Revised Estimates for financial years 2023-24 and 2022-23 are given respectively in Part A and Part B of the Press Note.
Key Highlights:
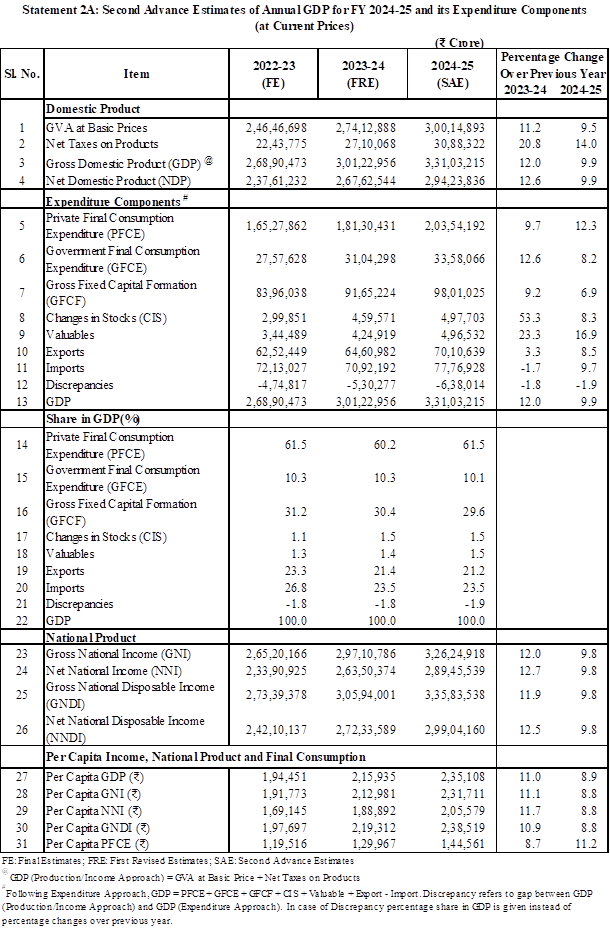
1. Real GDP has been estimated to grow by 6.5% in FY 2024-25. Nominal GDP is expected to witness a growth rate of 9.9% in FY 2024-25. Both the growth rates are revised upward from their respective First Advance Estimates.
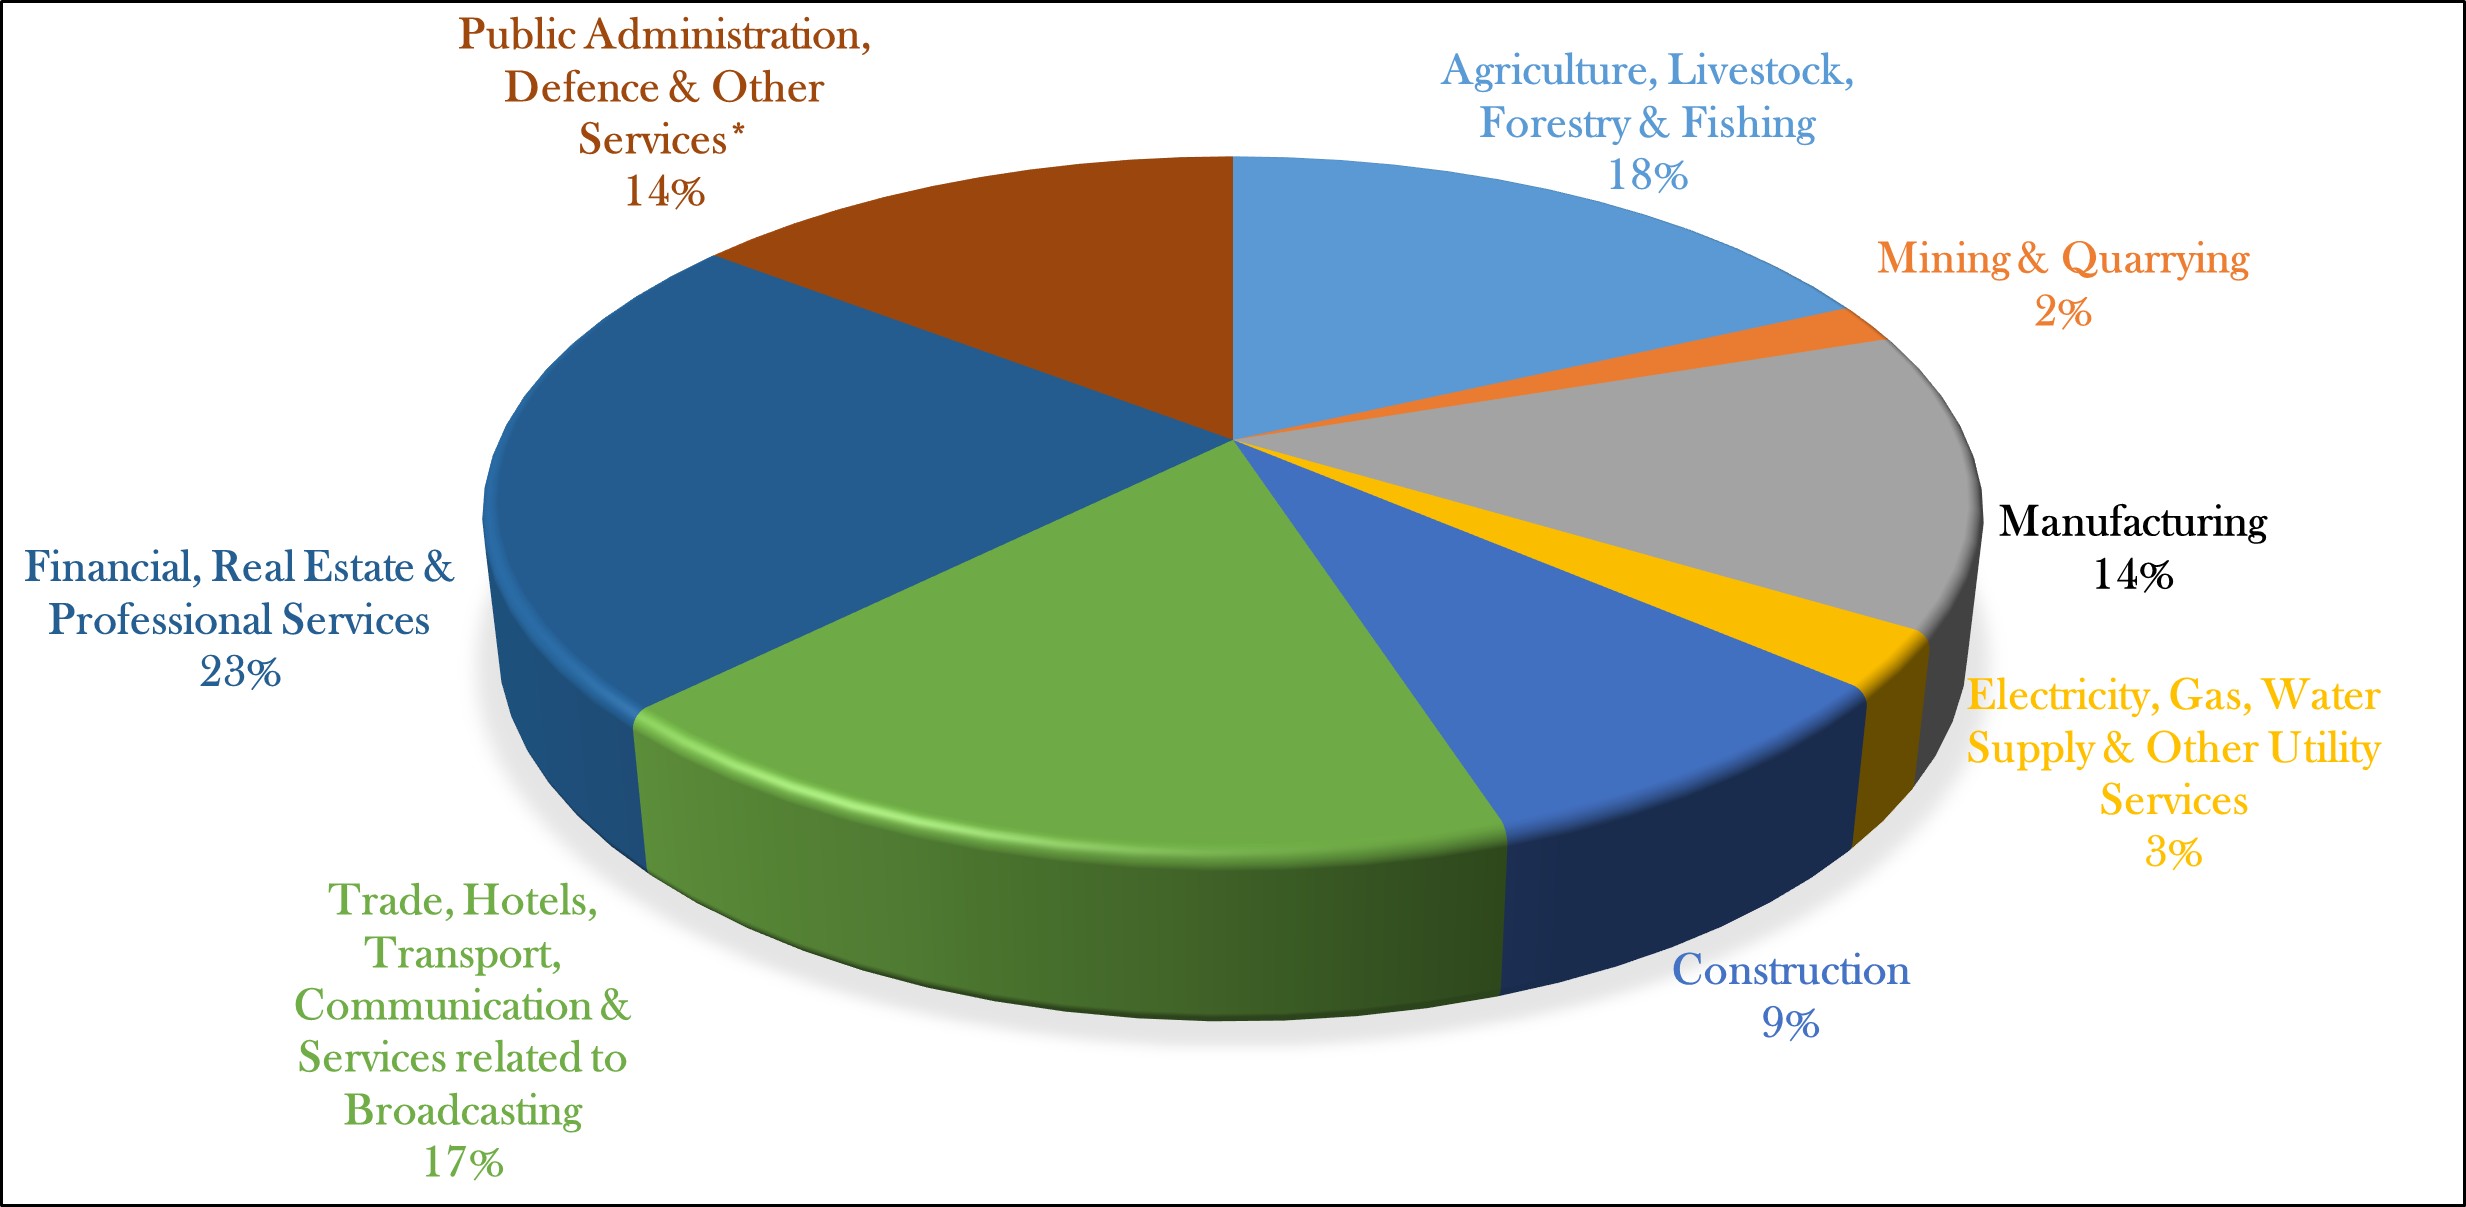
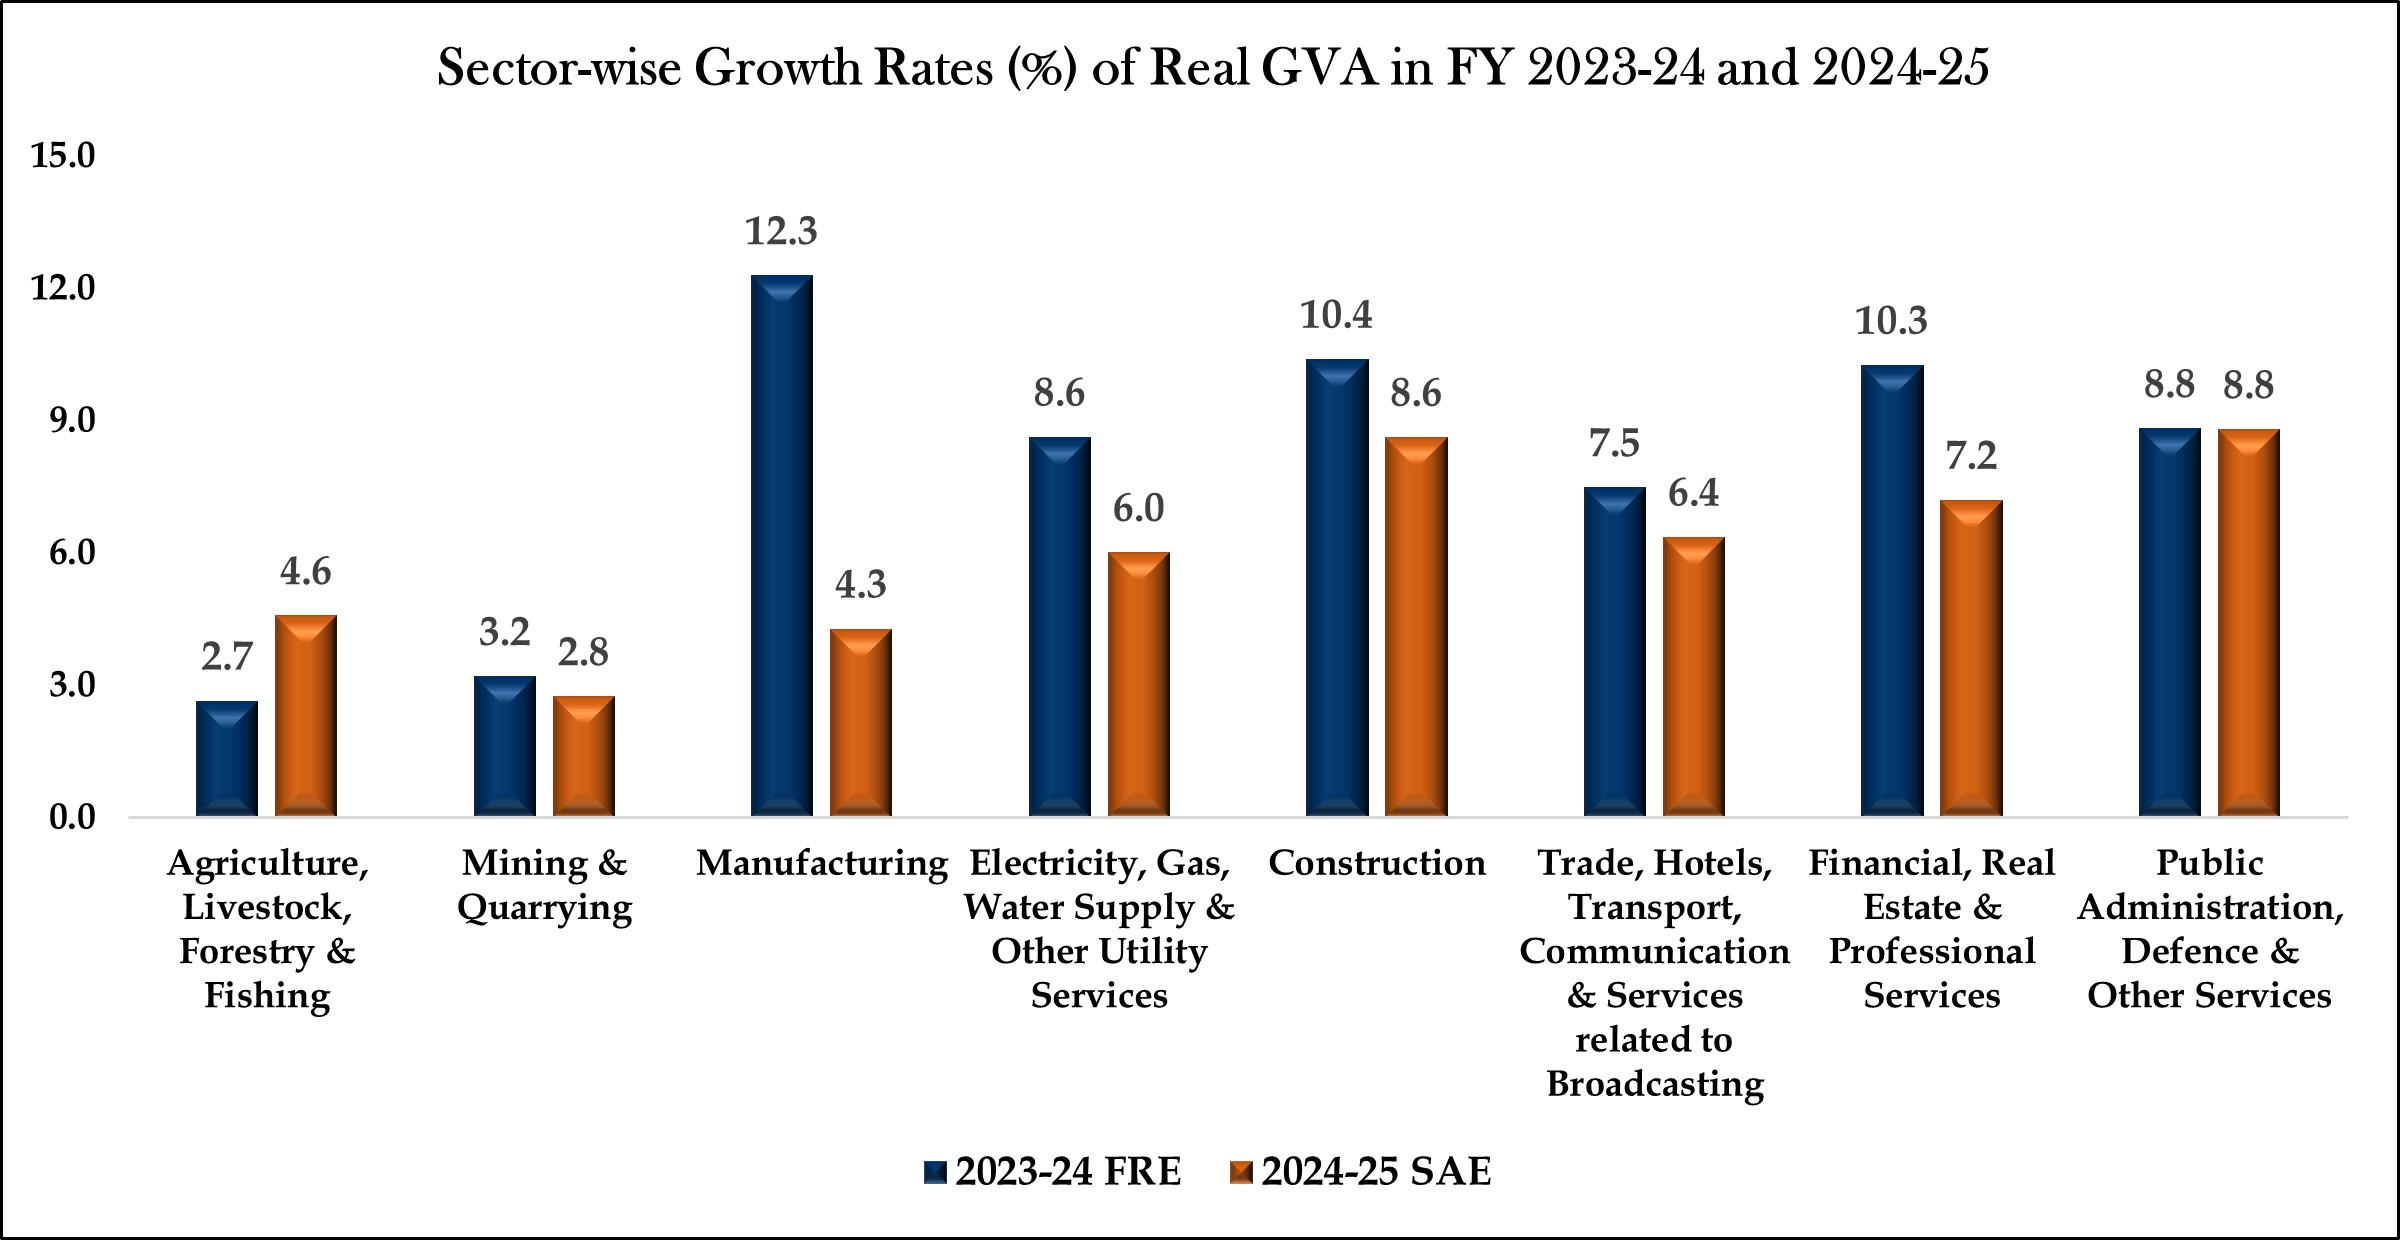
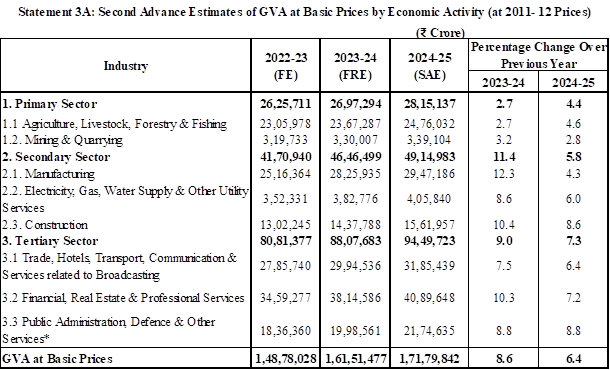
2. As per the First Revised Estimates, Real GDP has grown by 9.2% in the financial year 2023-24, which is highest in the previous 12 years except for the financial year 2021-22 (the post-covid year). This growth has been contributed by double-digit growth rates in ‘Manufacturing’ sector (12.3%), ‘Construction’ sector (10.4%) and ‘Financial, Real Estate & Professional Services’ sector (10.3%).
3. As per the Final Estimates, Real GDP has observed a growth rate of 7.6% in the financial year 2022-23, mainly contributed by double-digit growth rates in ‘Trade, Hotels, Transport, Communication & Services related to Broadcasting’ sector (12.3%), ‘Financial, Real Estate & Professional Services’ sector (10.8%) and ‘Electricity, Gas, Water Supply & Other Utility Services’ sector (10.8%).
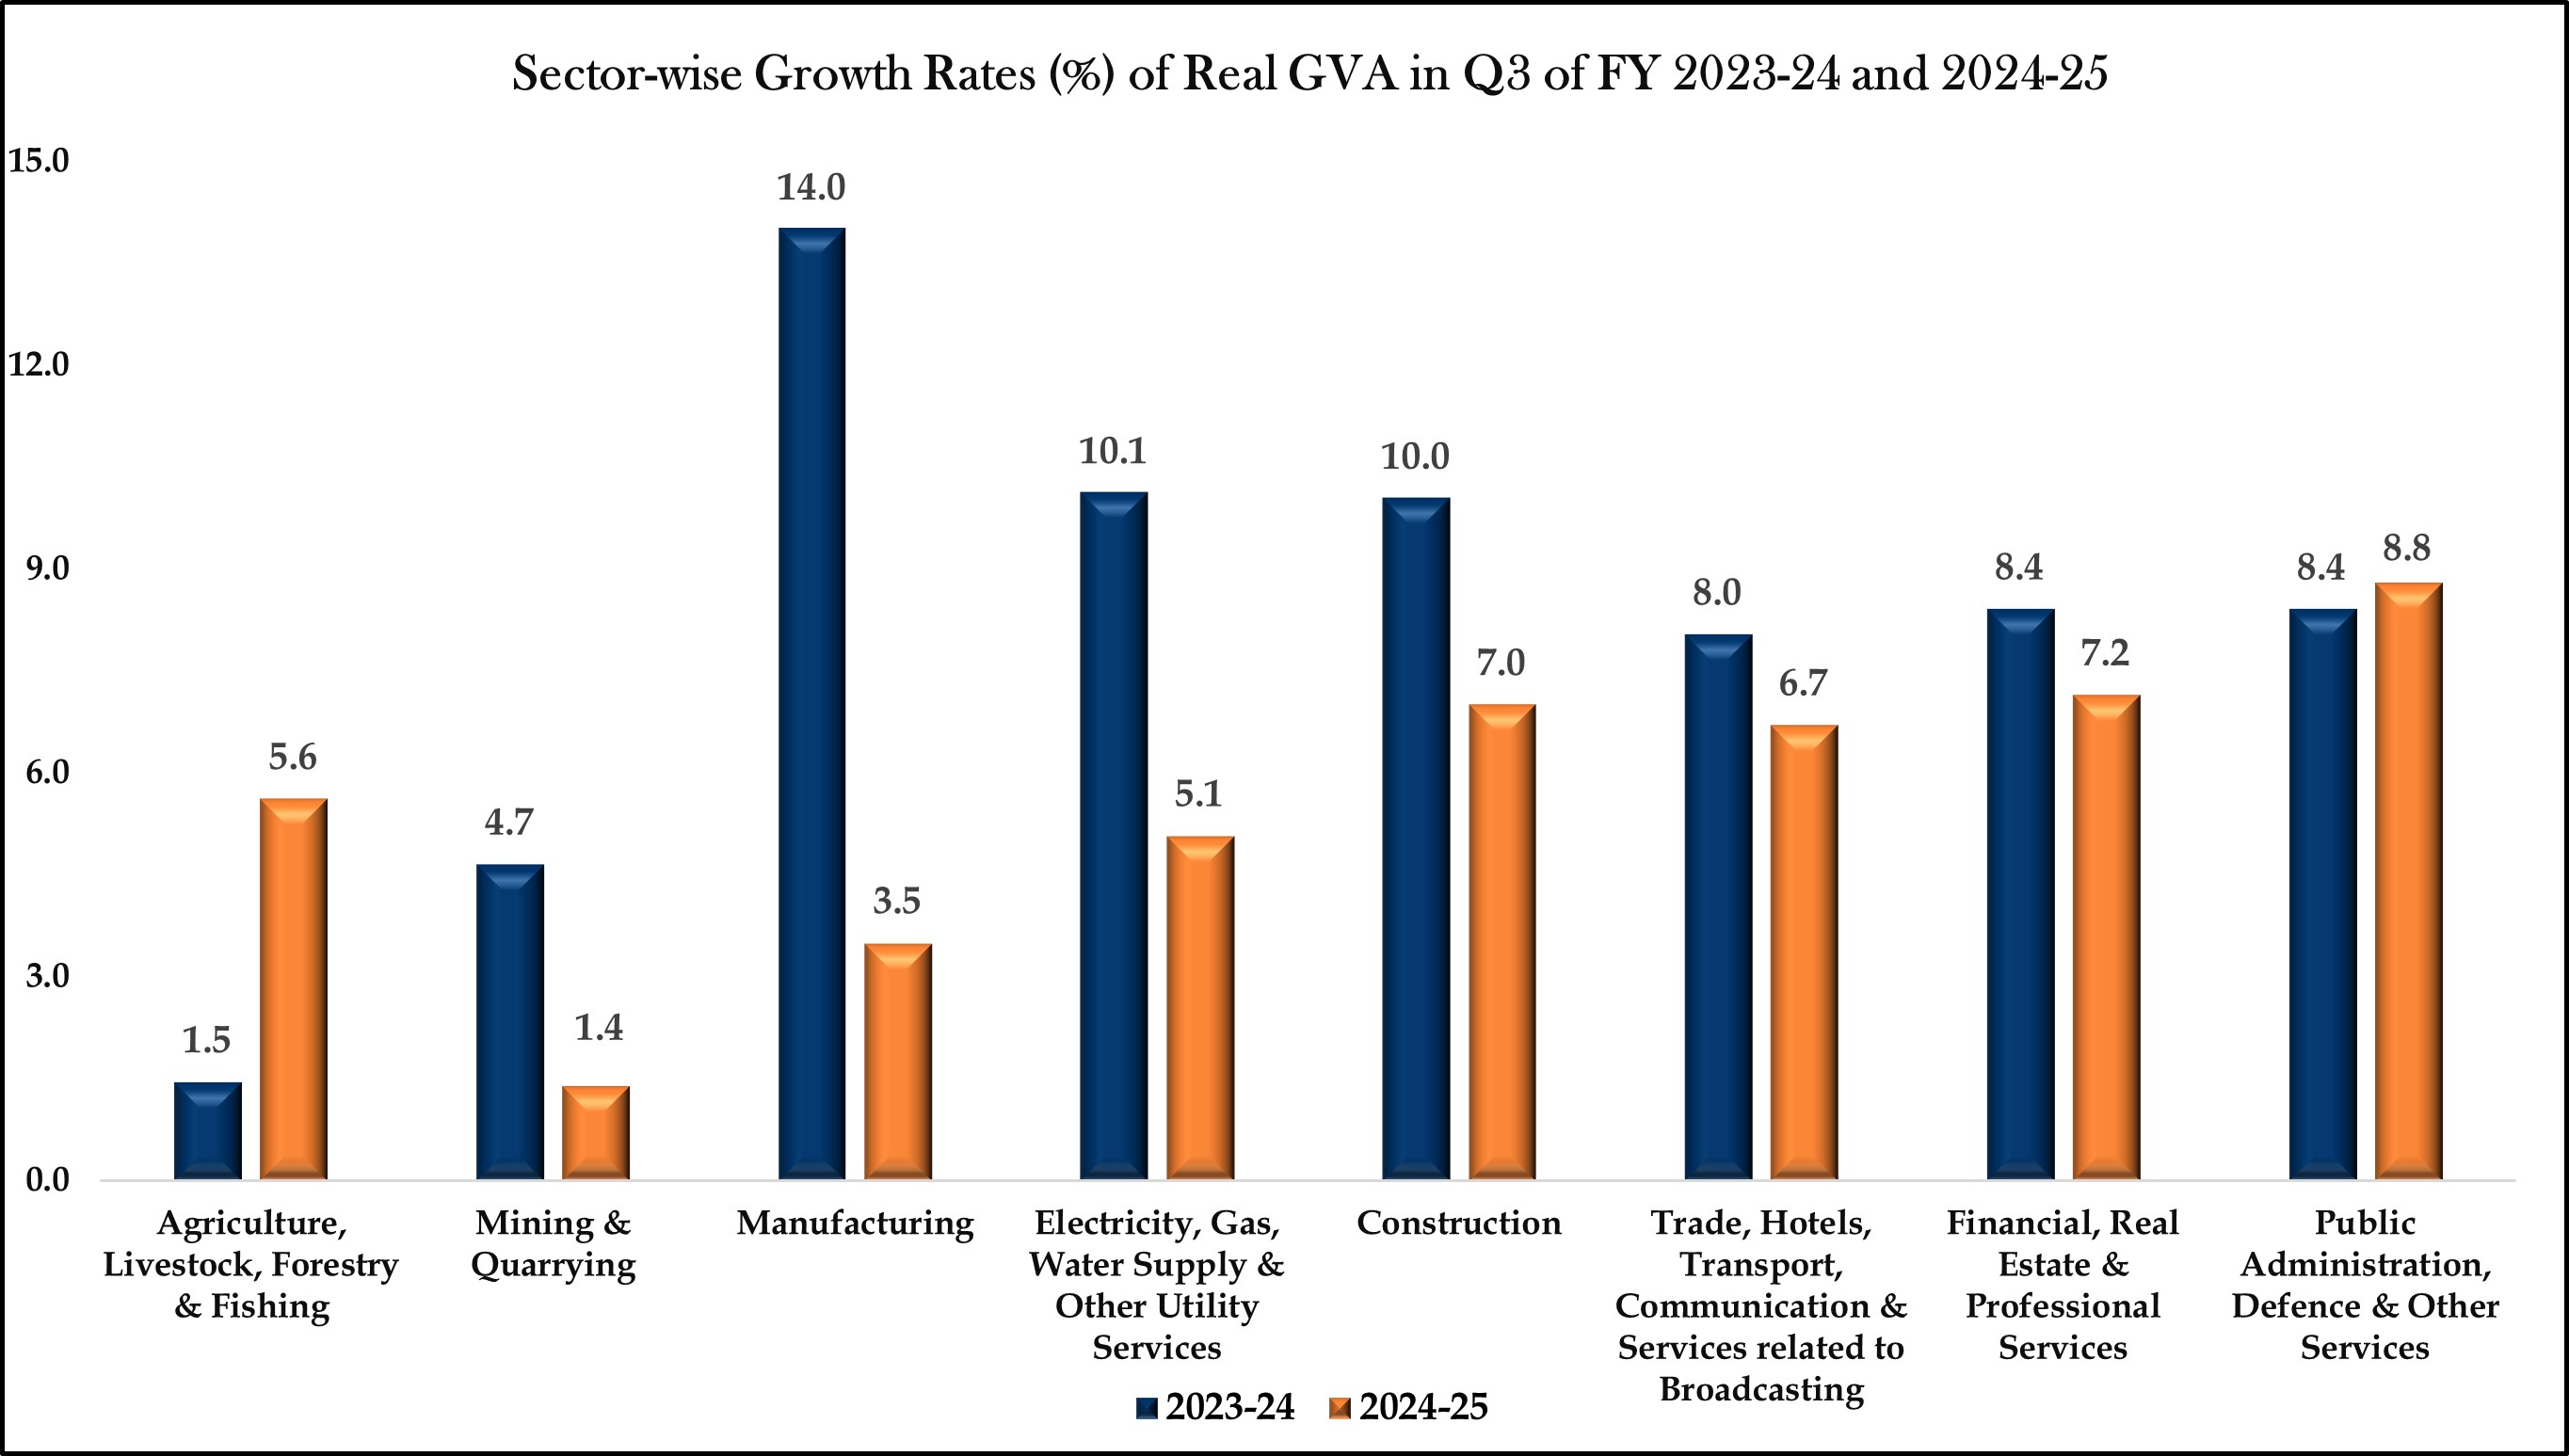
4. Real GDP is estimated to grow by 6.2% in Q3 of FY 2024-25. Growth rate in Nominal GDP for Q3 of FY 2024-25 has been estimated at 9.9%.
5. The growth rate of Real GDP for Q2 of financial year 2024-25 has been revised upward to 5.6%.
6. ‘Construction’ sector is estimated to observe a growth rate of 8.6%, followed by ‘Financial, Real Estate & Professional Services’ sector (7.2%) and ‘Trade, Hotels, Transport, Communication & Services related to Broadcasting’ sector (6.4%) during 2024-25.
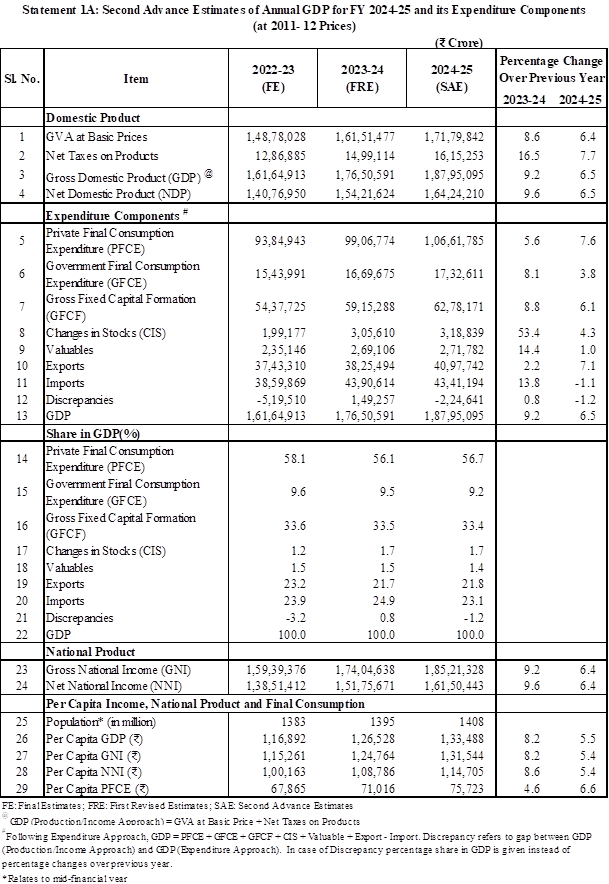
7. Private Final Consumption Expenditure (PFCE) is expected to register a good growth of 7.6% during 2024-25 as compared to 5.6% growth observed during 2023-24.
NOTE ON SECOND ADVANCE ESTIMATES OF ANNUAL GROSS DOMESTIC PRODUCT FOR 2024-25
QUARTERLY ESTIMATES OF GROSS DOMESTIC PRODUCT FOR THE THIRD QUARTER (OCT-DEC) OF 2024-25
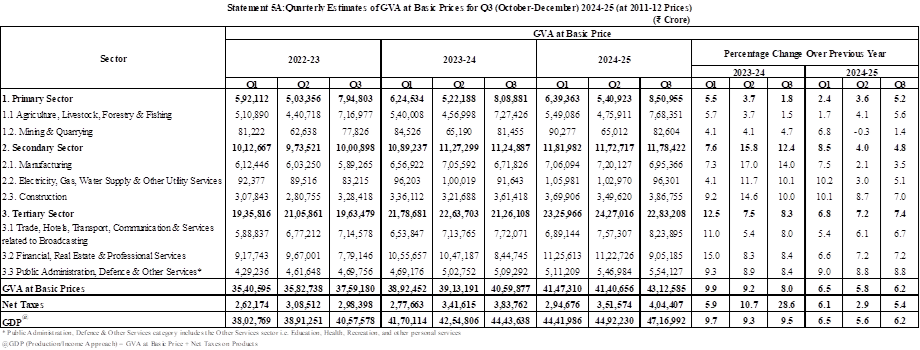
The National Statistics Office (NSO), Ministry of Statistics and Programme Implementation (MoSPI) is releasing in this Press Note, the Second Advance Estimates (SAE) of Annual Gross Domestic Product (GDP) for the Financial Year (FY) 2024-25 and Quarterly Estimates of GDP for the Third quarter (October-December) of 2024-25 along with its expenditure components both at Constant (2011-12) and Current Prices. Annual, Quarterly as well as April-December estimates of Gross Value Added (GVA) at Basic Prices by kind of economic activity along with year on year percent changes, expenditure components of GDP and annual estimates of Gross/Net National Income and Per Capita Income for the Financial years 2022-23, 2023-24 and 2024-25 at Constant and Current Prices are given in Statements 1A to 12A of Annexure A.
I. Annual Estimates and Growth Rates
Real GDP or GDP at Constant Prices is estimated to attain a level of ₹187.95 lakh crore in the financial year 2024-25, against the First Revised Estimate of GDP for the year 2023-24 of ₹176.51 lakh crore. The growth rate in Real GDP during 2024-25 is estimated at 6.5% as compared to 9.2% in 2023-24. Nominal GDP or GDP at Current Prices is estimated to attain a level of ₹331.03 lakh crore in the year 2024-25, against ₹301.23 lakh crore in 2023-24, showing a growth rate of 9.9%.
Real GVA is estimated at ₹171.80 lakh crore in the year 2024-25, against the FRE for the year 2023-24 of ₹161.51 lakh crore, registering a growth rate of 6.4% as compared to 8.6% growth rate in 2023-24. Nominal GVA is estimated to attain a level of ₹300.15 lakh crore during FY 2024-25, against ₹274.13 lakh crore in 2023-24, showing a growth rate of 9.5%
Fig. 1: Annual GDP and GVA Estimates along with Y-o-Y Growth Rates at Constant Prices
Fig. 2: Sectoral Composition and Growth Rates of Annual GVA
|
Sectoral Composition of Nominal GVA in FY 2024-25
|
|
|
|
|
Fig. 3: Composition and Growth Rates of Annual GVA in Broad Sectors
II. Quarterly Estimates and Growth Rates
Real GDP or GDP at Constant Prices in Q3 of FY 2024-25 is estimated at ₹47.17 lakh crore, against ₹44.44 lakh crore in Q3 of FY 2023-24, showing a growth rate of 6.2%. Nominal GDP or GDP at Current Prices in Q3 of FY 2024-25 is estimated at ₹84.74 lakh crore, against ₹77.10 lakh crore in Q3 of FY 2023-24, showing a growth rate of 9.9%.
Real GVA in Q3 of FY 2024-25 is estimated at ₹43.13 lakh crore, against ₹40.60 lakh crore in Q3 of FY 2023-24, showing a growth rate of 6.2%. Nominal GVA in Q3 of FY 2024-25 is estimated at ₹77.06 lakh crore, against ₹69.90 lakh crore in Q3 of FY 2023-24, showing a growth rate of 10.2%.
Fig. 4: Quarterly GDP and GVA Estimates along with Y-o-Y Growth Rates from Q1 FY 2021-22 to Q3 FY 2024-25 at Constant Prices
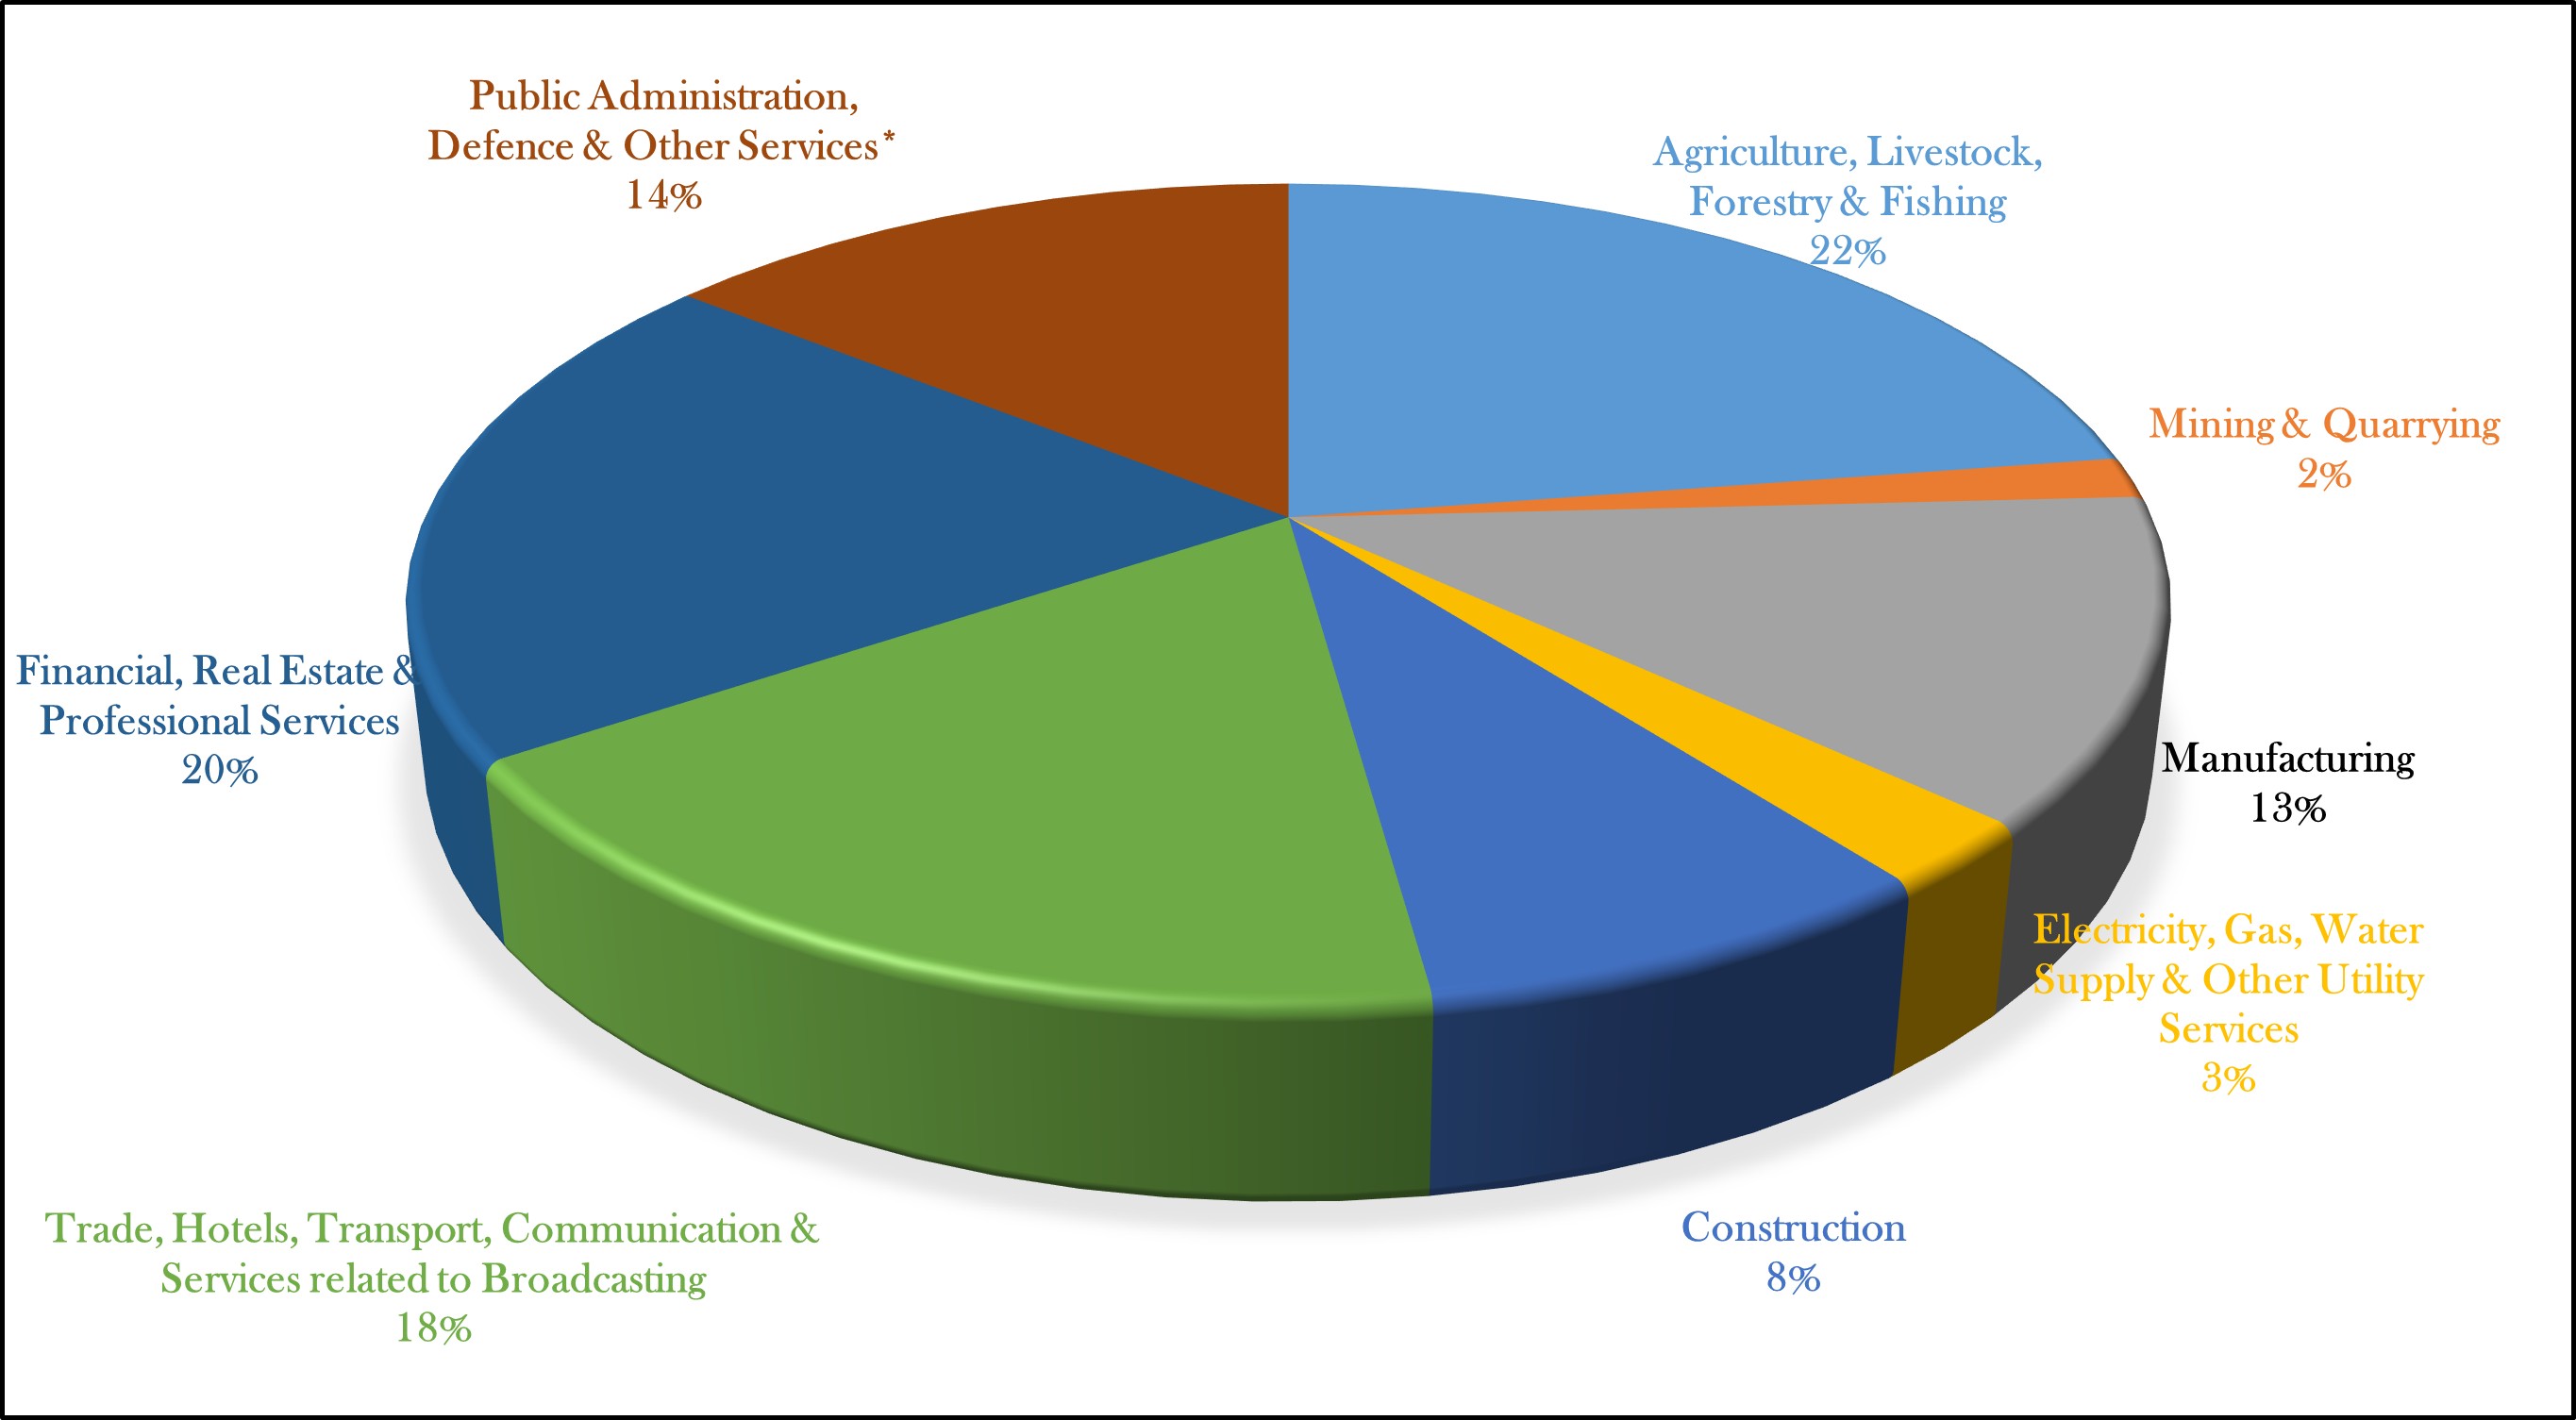
Fig. 5: Sectoral Composition and Growth Rates of Quarterly GVA
|
Sectoral Composition of Nominal GVA in Q3 of FY 2024-25
|
|
|
|
|
Fig. 6: Composition and Growth Rates of Quarterly GVA in Broad Sectors
[Primary Sector: Agriculture, Livestock, Forestry & Fishing and Mining & Quarrying
Secondary Sector: Manufacturing, Electricity, Gas, Water supply & Other Utility Services and Construction
Tertiary Sector: Trade, Hotels, Transport, Communication and Services related to Broadcasting, Financial, Real Estate & Professional Services and Public Administration, Defence & Other Services]
III. Methodology and Major Data Sources:
Second Advance Estimates of Annual GDP and Quarterly Estimates GDP are compiled using the Benchmark-indicator method i.e. the estimates available for the previous financial year (2023-24) are extrapolated using the relevant indicators reflecting the performance of sectors. The First Advance Estimates (FAE) of Annual GDP for the financial year 2024-25 were released on 7th January, 2025, which were based on very limited data and used Provisional Estimates of 2023-24 as Benchmark Estimates. For Compilation of SAE, 2024-25, the Provisional Estimates of 2023-24 used at the time of FAE have been replaced by FRE, 2023-24 which have been compiled using industry-wise/institution-wise detailed information. Thus, overall as well as sectoral variations in SAE from FAE is attributed to revision of benchmark estimates and additional or updated data available on various indicators. The quarterly estimates of previous years along with the First and Second quarter estimates of 2024-25 released earlier have also undergone revision in accordance with the revision policy of National Accounts.
The sector-wise estimates have been compiled using indicators/data sources like (i) Index of Industrial Production (IIP), (ii) Financial performance of Listed Companies based on available quarterly financial results of these companies upto Q3 FY 2024-25, (iii) Estimates of Major Agricultural Crops and Horticultural crops for 2024-25, as provided by Ministry of Agriculture and Farmers’ Welfare (iv) Production Targets and Summer as well as Rainy season production estimates of Major Livestock Products for FY 2024-25; (v) Fish Production, (vi) Production of Coal, Crude Petroleum, Natural Gas, Cement and Consumption of Steel, (vii) Net Tonne Kilometres and Passenger Kilometres for Railways, (viii) Passenger and Cargo traffic handled by Civil Aviation, (ix) Cargo traffic handled at Major and Minor Sea Ports, (x) Sales of Commercial Vehicles, (xi) Bank Deposits and Credits, (xii) Premium related information of Life and Non-Life Insurance companies, (xiii) Data on outward Supplies of Goods and Services available from GSTN upto January, 2025 (xiv) Accounts of Central and State Governments, (xv) Goods and Services Tax collections etc., available for first 9-10 months of the FY 2024-25. Year-on-Year growth rates (%) in the main indicators used in the estimation are given in the Annexure B.
Total tax revenue used for GDP compilation includes non-GST revenue as well as GST revenue. The Revised Estimates of Tax revenue for 2024-25 as available in the Annual Financial Statement of the Central Government, along with latest available information from the websites of Controller General of Accounts (CGA) and Comptroller and Auditor General of India (CAG) have been used for estimating taxes on products at Current Prices. For compiling taxes on products at Constant Prices, volume extrapolation is done using volume growth of taxed goods and services. The total product subsidies at Current prices were compiled using the latest information on major subsidies viz. Food, Urea, Petroleum and Nutrient based subsidy for Centre as available on CGA website and the expenditure incurred on subsidies by most States up to December 2024 as available on CAG website along with the Centre/State-wise RE and BE provision for FY 2024-25. Information available on Revenue expenditure, Interest payments, Subsidies etc. from Centre and States for FY 2024-25 were used for estimating Government Final Consumption Expenditure (GFCE).
Improved data coverage and revision in input data made by source agencies would have a bearing on subsequent revisions of these estimates. Estimates are, therefore, likely to undergo revisions for the aforesaid causes in due course, as per the release calendar. Users should take these into consideration while interpreting the figures. The Provisional Estimates of Annual GDP for FY 2024-25 along with Quarterly GDP estimates for the quarter January-March of FY 2024-25 (Q4 2024-25) will be released on 30.05.2025.
***********
Annexure A
NOTE ON FIRST REVISED & FINAL ESTIMATES OF GROSS DOMESTIC PRODUCT, NATIONAL INCOME, CONSUMPTION EXPENDITURE, SAVING AND CAPITAL FORMATION FOR 2023-24 & 2022-23 RESPECTIVELY
In this part of the press note, First Revised Estimates of GDP, National Income, Consumption Expenditure, Saving and Capital Formation for the financial year 2023-24 and Second Revised/ Final Estimates for the financial year 2022-23 are given.
2. The First Revised Estimates for the year 2023-24 have been compiled using industry-wise/institution-wise detailed information instead of using the benchmark-indicator method employed at the time of release of Provisional Estimates on 31st May, 2024. The estimates of Gross Domestic Product (GDP) and other aggregates for the year 2022-23 have also undergone revisions on account of use of latest available datasets on agricultural production; industrial production (final results of Annual Survey of Industries: 2022-23); government data as available in budget documents (replacing Revised Estimates with actuals for the year 2022-23); comprehensive data available from various source agencies like Ministry of Corporate Affairs (MCA), Reserve Bank of India (RBI), National Bank for Agriculture and Rural Development (NABARD) etc. and additional data from State/UT Directorates of Economics and Statistics (DES).
3. The salient features of the revised estimates at aggregate level are given in the paras as follows.
Gross Domestic Product
4. Real GDP or GDP at constant (2011-12) prices for the years 2023-24 and 2022-23 stands at ₹176.51 lakh crore and ₹161.65 lakh crore, respectively, showing a growth of 9.2 per cent during 2023-24 as compared to growth of 7.6 per cent during 2022-23.
5. Nominal GDP or GDP at current prices for the year 2023-24 is estimated at ₹301.23 lakh crore, against ₹268.90 lakh crore for the year 2022-23, showing a growth of 12.0 per cent during 2023-24 as compared to growth of 14.0 per cent during 2022-23.
GVA and its Industry-wise Analysis
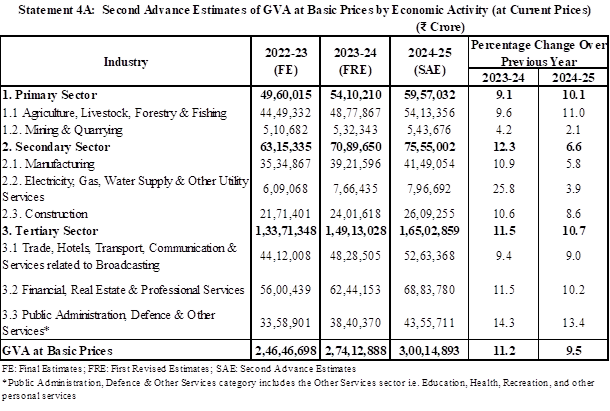
6. At the aggregate level, nominal Gross Value Added (GVA) at basic prices has increased by 11.2 per cent during 2023-24 compared to growth of 13.9 per cent during 2022-23. Real GVA, i.e., GVA at constant (2011-12) prices, has increased by 8.6 per cent in 2023-24, compared to 7.2 per cent growth in 2022-23.
7. The shares of broad sectors of the economy in overall GVA during 2011-12 to 2023-24 and the annual growth rates during these periods are mentioned below:
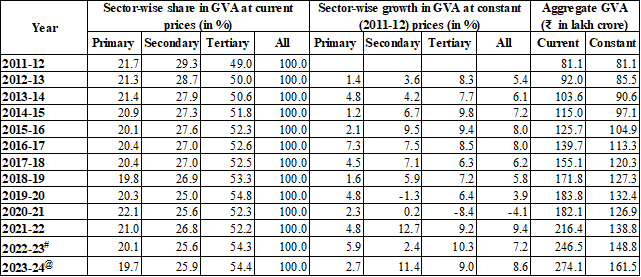
#: Final Estimates; @: First Revised Estimates
8. The growth rates of Primary sector (comprising Agriculture, Livestock, Forestry, Fishing and Mining & Quarrying), Secondary sector (comprising Manufacturing, Electricity, Gas, Water Supply & Other Utility Services, and Construction) and Tertiary sector (Services) have been estimated as 2.7 per cent, 11.4 per cent and 9.0 per cent respectively in 2023-24 as against growth rates of 5.9 per cent, 2.4 per cent and 10.3 per cent respectively in the previous years. The growth in real GVA during 2023-24 is on account of growth in ‘Manufacturing’, ‘Electricity, Gas, Water Supply & Other Utility Services’, ‘Construction’, ‘Trade, repair, Hotels and Restaurants’, ‘Financial Services’, ‘Real Estate, Ownership of Dwelling & Professional Services’ and ‘Other services’ as may be seen from Statement 4.2B. However, ‘Agriculture, Livestock, Forestry and Fishing’, ‘Mining and Quarrying’ and ‘Public Administration and Defense’ have witnessed modest growth.
Net National Income
9. Net National Income (NNI) at current prices for the year 2023-24 stands at ₹263.50 lakh crore as against ₹233.91 lakh crore in 2022-23, showing a growth of 12.7 per cent during 2023-24 as compared to growth of 13.3 per cent in the previous year.
Gross National Disposable Income
10. Gross National Disposable Income (GNDI) at current prices is estimated at ₹305.94 lakh crore for the year 2023-24, while the estimate for the year 2022-23 stands at ₹273.39 lakh crore, showing a growth of 11.9 per cent for year 2023-24 as compared to growth of 14.3 per cent in the year 2022-23.
Saving
11. Gross Saving during 2023-24 is estimated at ₹92.59 lakh crore against ₹82.44 lakh crore during 2022-23. Share of Non-financial corporations, Financial corporations, General Government and Household sectors in Gross Savings during 2023-24 stands at 36.0%, 8.2%, (-) 3.1% and 59.0% respectively. Rate of Gross Saving to GNDI for 2023-24 is estimated at 30.3 per cent as against 30.2 per cent for 2022-23.
Capital Formation
12. Gross Capital Formation (GCF) at current prices is estimated at ₹94.68 lakh crore for the year 2023-24 as compared to ₹87.72 lakh crore during 2022-23. The rate of GCF to GDP is 31.4 per cent during 2023-24 as against 32.6 per cent in the 2022-23. The rates of capital formation in the years 2011-12 to 2019-20 and 2021-22 to 2023-24 have been higher than the rate of saving because of positive net capital flow from Rest of the World (RoW).
13. In terms of the share to the total GFCF (at current prices), the highest contributor is Non-Financial Corporations followed by Household sector, share of which stood at 44.2% and 41.7% respectively in 2023-24.
14. The rate of GCF to GDP at constant (2011-12) prices was 35.2 per cent in 2022-23 and 34.6 per cent in 2023-24.
Consumption Expenditure
15. Private Final Consumption Expenditure (PFCE) at current prices is estimated at ₹181.30 lakh crore for the year 2023-24 as against ₹165.28 lakh crore in 2022-23. In relation to GDP, the PFCE to GDP ratio at current prices during 2022-23 and 2023-24 are 61.5 per cent and 60.2 per cent respectively. At constant (2011-12) prices, the PFCE is estimated at ₹93.85 lakh crore and ₹99.07 lakh crore, respectively for the years 2022-23 and 2023-24. The corresponding PFCE to GDP ratio for the years 2022-23 and 2023-24 are 58.1 per cent and 56.1 per cent respectively.
16. Government Final Consumption Expenditure (GFCE) at current prices is estimated at ₹31.04 lakh crore for the year 2023-24 as against ₹27.58 lakh crore during 2022-23. At constant (2011-12) prices the estimates of GFCE for the years 2022-23 and 2023-24 stand at ₹15.44 lakh crore and ₹16.70 lakh crore respectively.
Per Capita Estimates
17. Per Capita Income i.e. Per Capita Net National Income at current prices is estimated at ₹1,69,145 and ₹1,88,892 respectively for the years 2022-23 and 2023-24. Per Capita PFCE at current prices, for the years 2022-23 and 2023-24 is estimated at ₹1,19,516 and ₹1,29,967 respectively.
Summary of Revisions in the GDP Estimates
Revision in the estimates of the year 2023-24
18. The following statement gives the major reasons of variation between the Provisional Estimates (released on 31st May, 2024) and the First Revised Estimates of GVA for 2023-24.
|
Sector
|
GVA growth in 2023-24
(at 2011-12 Prices)
|
Major reasons for variation
|
|
Provisional Estimate (PE),
May 2024
|
First Revised Estimate (FRE),
Feb 2025
|
|
Primary
|
2.1
|
2.7
|
GVA estimates of Agriculture, Livestock, Forestry and Fishing sectors have undergone revision due to revision in production estimates of crop sector as per Final Estimate of Ministry of Agriculture and Farmers welfare. The revision in other industries in Primary Sector is due to the incorporation of latest revised data.
|
|
Secondary
|
9.7
|
11.4
|
Estimates of secondary sector have undergone revision due to use of data from source agencies along with detailed analysis of Non-departmental Enterprises (NDE) & Private Corporate sectors and budget documents of Government whereas provisional estimates were indicator based.
|
|
Tertiary
|
7.6
|
9.0
|
Data from source agencies along with detailed analysis of Departmental Enterprises (DE), NDE and Private Corporate sectors have been used for compilation of estimates for FRE 2023-24 whereas provisional estimates were indicator based. Furthermore, the revision in Public Administration and Defence sector is due to the use of detailed analysis of Budget documents (Centre and State Governments) and latest information of Local Bodies and Autonomous Bodies. In case of Financial services, FRE is based on analysis of annual reports of Financial Corporations and data released by RBI, NABARD and other financial regulators.
|
|
Total GVA at Basic Prices
|
7.2
|
8.6
|
|
|
GDP
|
8.2
|
9.2
|
|
[Primary Sector: Agriculture, Livestock, Forestry & Fishing and Mining & Quarrying
Secondary Sector: Manufacturing, Electricity, Gas, Water supply & Other Utility Services and Construction
Tertiary Sector: Trade, Hotels, Transport, Communication and Services related to Broadcasting, Financial, Real Estate & Professional Services and Public Administration, Defence & Other Services]
Revisions in the estimates of the year 2022-23
19. The use of latest available data from various agencies has resulted in changes in both the levels of GVA and growth estimates for the years 2022-23.
Revisions in Major Aggregates
20. The level of revisions in the major aggregates at current and constant (2011-12) prices are given in the following table:
Major National Income Aggregates and their % Changes
(₹ in Lakh Crore)
|
Sl. No.
|
Item
|
2022-23
|
|
1st RE
|
Final Estimates
|
% change
|
|
At Current Prices
|
|
1
|
GVA at basic prices
|
246.59
|
246.47
|
-0.1
|
|
2
|
GDP
|
269.50
|
268.90
|
-0.2
|
|
3
|
GNI
|
265.79
|
265.20
|
-0.2
|
|
4
|
NNI
|
234.39
|
233.91
|
-0.2
|
|
5
|
GNDI
|
273.99
|
273.39
|
-0.2
|
|
At Constant Prices
|
|
1
|
GVA at basic prices
|
148.05
|
148.78
|
0.5
|
|
2
|
GDP
|
160.71
|
161.65
|
0.6
|
|
3
|
GNI
|
158.31
|
159.39
|
0.7
|
|
4
|
NNI
|
137.47
|
138.51
|
0.8
|
Major reasons for revisions in GVA/GDP estimates for FY 2022-23 are as given below:
- Use of updated production estimates (Final Estimates) of horticulture crops from Ministry of Agriculture and Farmers’ Welfare, increase in area under fodder crop and increase in production of sugarcane.
- Increase in input value due to use of Cost of Cultivation Survey (CCS) 2022-23 and Electricity tariff for agriculture sector for the year 2022-23.
- Use of updated information from NDE and updated information on minor minerals from States in case of Mining & Quarrying sector.
- Use of final results of Annual Survey of Industries (ASI): 2022-23 and augmented data for non-financial private corporate sector.
- Use of ‘Actuals’ in place of ‘Revised Estimates’ of different items of expenditure and receipts in the Central & State government budgets.
- Use of updated information on Local Bodies & Autonomous Institutions.
- Use of latest annual reports of Public Sector Enterprises.
- Use of latest data received for Cooperative Banks, Post Office Saving Bank (POSB), Non-Banking Financial Institutions (NBFIs), and Financial Auxiliaries.
Detailed statements
21. List of Statements released in part ‘B’ of the press note is given below. More details of the revised estimates, i.e., FRE 2023-24 and FE 2022-23 are available in Statements 1.1B to 9B of Annexure C, which are given in the PDF format of the press note.
- Statement 1.1B: Key Aggregates of National Accounts at Current Prices
- Statement 1.2B: Key Aggregates of National Accounts at Constant (2011-12) Prices
- Statement 2B: Per Capita Income, Product and Final Consumption
- Statement 3.1B: Output by Economic Activity and Capital Formation by Industry of Use at Current Prices
- Statement 3.2B: Output by Economic Activity and Capital Formation by Industry of Use at Constant (2011-12) Prices
- Statement 4.1B: Gross Value Added by Economic Activity at Current Basic Prices
- Statement 4.2B: Gross Value Added by Economic Activity at Constant (2011-12) Basic Prices
- Statement 5B: Finances for Gross Capital Formation
- Statement 6.1B: Gross Capital Formation by Industry of Use at Current Prices
- Statement 6.2B: Gross Capital Formation by Industry of Use at Constant (2011-12) Prices
- Statement 7.1B: Gross Fixed Capital Formation by Asset & Institutional Sector at Current Prices
- Statement 7.2B: Gross Fixed Capital Formation by Asset & Institutional Sector at Constant (2011-12) Prices
- Statement 8.1B: Private Final Consumption Expenditure at Current Prices
- Statement 8.2B: Private Final Consumption Expenditure at Constant (2011-12) Prices
- Statement 9B: Institutional Sectors – Key Economic Indicators at Current Prices
**************
Annexure C
FORMULAE
- GVA at basic prices (Production Approach) = Output at basic prices – Intermediate Consumption
- GVA at basic prices (Income Approach) = CE + OS/MI + CFC + Production taxes less Production subsidies(i)
- GDP = ∑ GVA at basic prices + Product taxes less Product subsidies(ii)
- NDP/NNI = GDP/GNI - CFC
- GNI = GDP + Net primary income from ROW (Receipts less payments)
- Primary Incomes = CE + Property and Entrepreneurial Income
- NNDI =NNI + other current transfers(iii) from ROW, net (Receipts less payments)
- GNDI = NNDI + CFC = GNI + other current transfers(iii) from ROW, net (Receipts less payments)
- Gross Capital Formation(iv) (Financing Side) = Gross Savings + Net Capital Inflow from ROW
- GCF (Expenditure Side) = GFCF + CIS + Valuables
- Gross Disposable Income of Govt. = GFCE + Gross Saving of General Government
- Gross Disposable Income (GDI) of Households = GNDI – GDI of Govt. – Gross Savings of All Corporations
REMARKS ON THE FORMULAE
- Production taxes or subsidies are paid or received with relation to production and are independent of the volume of actual production. Some examples are:
Production Taxes - Land Revenues, Stamps & Registration fees and Tax on profession
Production Subsidies - Subsidies to Railways, Subsidies to village and small industries.
- Product taxes or subsidies are paid or received on per unit of product. Some examples are:
Product Taxes- Goods & Service Tax, Excise duties, Sales tax, Service Tax and Import, Export duties
Product Subsidies- Food, Petroleum and fertilizer subsidies.
- Other Current Transfers refers to current transfers other than the primary incomes.
Gross Capital Formation (GCF) at the current as well as the constant prices is estimated by two approaches: – (i) through flow of funds, derived as Gross Saving plus net capital flow from Rest of the World (RoW); and (ii) by the commodity flow approach, derived by the type of assets.
Click here to see Press Note in PDF format
********
Samrat/ Dheeraj/Allen
(Release ID: 2106921)
Visitor Counter : 29258