Ministry of Commerce & Industry
The removal of additional retaliatory duties for import of US apples will not result in any negative impact on domestic apple producers
MFN duty of 50% continues to be applicable on US apples as only additional 20% duty to be removed
Apples from the US to compete on level playing field with other countries
Resolution of dispute to restore market access for Indian steel and aluminum exports to the US
प्रविष्टि तिथि:
26 JUN 2023 7:29PM by PIB Delhi
With the decision of resolution of six outstanding World Trade Organisation (WTO) disputes between US and India through mutually agreed solutions as jointly communicated during the official state visit of the Prime Minister to the USA, India will remove additional duties on eight US products, including apples, leading to restoration of market access for Indian steel and aluminum exports to the US.
The decision will not result in any negative impact on domestic apple producers and will result in competition in premium market segment ensuring better quality at better prices for consumers.
After removal of this duty, the apples from the US would compete on level playing field with other countries.
The decision will ensure that only premium quality apples could be imported for which there exists a specific market segment and specific demand.
An additional 20% duty was imposed on US apples in 2019 in response to USA's measure to increase tariffs on certain steel and aluminum products. There is no reduction on Most Favoured Nation (MFN) duty on apples which is still applicable on all imported apples including on USA at 50%.
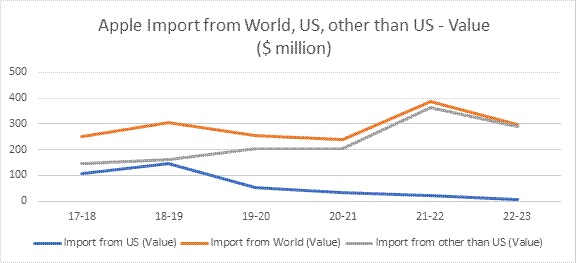
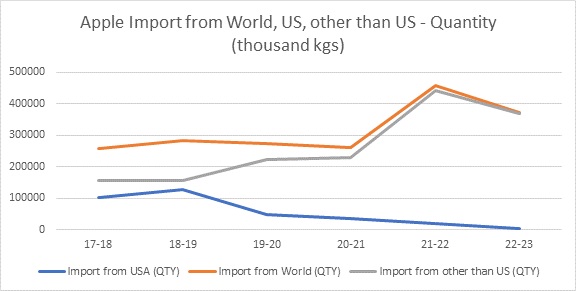
The import of apples from the world has been stable in the range of US$ 239 – 305 million (except in 2021-22 when it was US$ 385 million) in the last five financial years since application of these additional duties on US apples. The import of apples from USA has decreased from US$ 145 million (127,908 Ton) in FY 2018-19 to only US$ 5.27 million (4,486 Ton) in FY 2022-23.
The market share of the US apples was taken by other countries due to imposition of additional retaliatory duty on US apples. This is reflected as the import of apples from countries other than the US increased from US$ 160 million in FY 2018-19 to US$ 290 million in FY 2022-23. Turkey, Italy, Chile, Iran and New Zealand are other top exporters to India of apples which took the market share of the US.
Further on 8 May 2023, DGFT vide notification 5/ 2023 made amendment in import policy for Apples under ITC (HS) 08081000 by applying MIP (Minimum Import Price) of Rs 50 per Kg for all countries except Bhutan. Therefore, this MIP will also be applicable on apples from US as well as other countries (excluding Bhutan), thus preventing any flooding and protecting domestic growers from predatory pricing.
After application of additional duty on US apples, its share in premium market segment was taken by countries like Turkey, Brazil, New Zealand, Italy, etc. as mentioned above.
Data pertaining to apple import is given below:


|
FY
|
Import from US (Value)
|
Import from USA (QTY)
|
Import from World (Value)
|
Import from World (QTY)
|
Import from other than US (QTY)
|
Import from other than US (Value)
|
MFN Duty (BCD+AIDC - as applicable)
|
|
22-23
|
5.27
|
4,486.48
|
295.94
|
373505.70
|
3,69,019.22
|
290.67
|
50
|
|
21-22
|
21.82
|
18,396.02
|
385.10
|
459251.84
|
4,40,855.82
|
363.28
|
50
|
|
20-21
|
34.60
|
34,288.73
|
239.59
|
262233.08
|
2,27,944.35
|
204.99
|
50
|
|
19-20
|
51.58
|
48,282.48
|
254.55
|
272435.28
|
2,24,152.80
|
202.97
|
50
|
|
18-19
|
145.20
|
1,27,908.23
|
305.71
|
283331.36
|
1,55,423.13
|
160.51
|
50
|
|
17-18
|
107.18
|
1,01,917.73
|
252.26
|
257956.77
|
1,56,039.04
|
145.08
|
50
|
|
Quantity in Thousand KGs and Value in US$ million
|
|
|
|
Importing Countries (Sorted according to last year import)
|
Country
|
2021-2022
(Value)
|
2022-2023
(Value)
|
%Growth
|
2021-2022
(QTY)
|
2022-2023
(QTY)
|
%Growth
|
|
TURKEY
|
80.06
|
84.14
|
5.1
|
93,900.68
|
1,07,219.76
|
14.18
|
|
ITALY
|
50.25
|
39.10
|
-22.2
|
49,791.86
|
46,087.30
|
-7.44
|
|
CHILE
|
59.66
|
38.60
|
-35.3
|
55,676.87
|
34,093.66
|
-38.77
|
|
IRAN
|
58.10
|
35.01
|
-39.74
|
1,12,102.53
|
80,346.55
|
-28.33
|
|
NEW ZEALAND
|
40.70
|
23.27
|
-42.82
|
31,003.43
|
19,126.09
|
-38.31
|
|
POLAND
|
9.76
|
20.95
|
114.59
|
11,293.43
|
26,323.86
|
133.09
|
|
SOUTH AFRICA
|
10.13
|
19.89
|
96.36
|
9,922.56
|
19,256.85
|
94.07
|
|
BRAZIL
|
21.71
|
10.51
|
-51.62
|
23,961.62
|
11,523.87
|
-51.91
|
|
BELGIUM
|
2
|
6.33
|
216.65
|
1,947.47
|
8,049.01
|
313.31
|
|
U S A
|
21.82
|
5.27
|
-75.86
|
18,396.02
|
4,486.48
|
-75.61
|
|
U ARAB EMTS
|
20.42
|
3.33
|
-83.69
|
40,274.25
|
6,917.42
|
-82.82
|
|
SERBIA
|
2.24
|
3.22
|
43.65
|
2,295.65
|
3,327.86
|
44.96
|
|
AFGHANISTAN
|
1.89
|
1.54
|
-18.5
|
2,015.77
|
1,508.50
|
-25.16
|
|
FRANCE
|
2.85
|
1.24
|
-56.63
|
3,101.84
|
1,420.24
|
-54.21
|
|
PORTUGAL
|
0.53
|
0.94
|
77.24
|
520.25
|
1,058.40
|
103.44
|
|
SPAIN
|
0.65
|
0.69
|
5.4
|
554.81
|
617.47
|
11.29
|
|
ARGENTINA
|
1.22
|
0.64
|
-47.7
|
1,229.89
|
578.31
|
-52.98
|
|
NETHERLAND
|
0.51
|
0.49
|
-4.2
|
533.75
|
515.27
|
-3.46
|
|
CROATIA
|
0.03
|
0.34
|
1,077.08
|
41.83
|
405.31
|
868.91
|
|
BHUTAN
|
0.05
|
0.09
|
84.12
|
192.49
|
173.25
|
-10
|
|
GREECE
|
0.15
|
0.09
|
-39.96
|
122.42
|
102.41
|
-16.34
|
|
AUSTRALIA
|
0.11
|
0.06
|
-44.54
|
120.15
|
84.67
|
-29.53
|
|
GERMANY
|
0.11
|
0.06
|
-42.57
|
119.66
|
60.23
|
-49.67
|
|
ROMANIA
|
|
0.05
|
|
|
60.68
|
|
|
SLOVENIA
|
0.02
|
0.05
|
150.48
|
20.16
|
78.97
|
291.7
|
|
EGYPT A RP
|
0.02
|
0.03
|
63.54
|
21.2
|
41.47
|
95.62
|
|
MOLDOVA
|
|
0.02
|
|
|
20.36
|
|
|
SINGAPORE
|
|
0.01
|
|
|
20.56
|
|
|
THAILAND
|
0
|
0
|
-29.73
|
1.59
|
0.89
|
-43.8
|
|
CHINA P RP
|
0.05
|
|
|
48.5
|
|
|
|
HONG KONG
|
0.06
|
|
|
41.16
|
|
|
|
Total
|
385.1
|
295.94
|
-23.15
|
4,59,251.84
|
3,73,505.70
|
|
India’s Apple Import from USA (Values in US$ Million &Quantity in Thousand KGS)
|
FY
|
Import from US (Value)
|
Import from USA (QTY)
|
Import from World (Value)
|
Import from World (QTY)
|
|
22-23
|
5.27
|
4,486.48
|
295.94
|
373505.7
|
|
21-22
|
21.82
|
18,396.02
|
385.1
|
459251.84
|
|
20-21
|
34.6
|
34,288.73
|
239.59
|
262233.08
|
|
19-20
|
51.58
|
48,282.48
|
254.55
|
272435.28
|
|
18-19
|
145.2
|
1,27,908.23
|
305.71
|
283331.36
|
|
17-18
|
107.18
|
1,01,917.73
|
252.26
|
257956.77
|
|
16-17
|
70.08
|
60764.31
|
300.96
|
323834.25
|
|
15-16
|
103.89
|
94721.94
|
216.11
|
208428.2
|
|
14-15
|
75.74
|
59814.07
|
230.8
|
198599.81
|
|
13-14
|
64.86
|
49050.53
|
200.88
|
175355.68
|
|
12-13
|
82.83
|
70129.21
|
213.91
|
202278.67
|
|
11-12
|
76.95
|
68809.35
|
197.06
|
188071.6
|
|
10-11
|
44.09
|
39042.11
|
137.1
|
134576.9
|
|
9-10
|
41.14
|
41282.62
|
91.82
|
98895.28
|
|
8-9
|
20.07
|
18366.06
|
72.08
|
71203.76
|
|
7-8
|
19.49
|
19500.5
|
52.47
|
58401.19
|
|
6-7
|
17.91
|
26057.21
|
32.75
|
48982.29
|
|
5-6
|
10.69
|
16689.85
|
20.46
|
32367.81
|
|
4-5
|
5.49
|
8273.42
|
13.7
|
21622.09
|
|
3-4
|
2.47
|
4179.68
|
11.68
|
18578.17
|
Source: DGCI&S Kolkata
(रिलीज़ आईडी: 1935460)
आगंतुक पटल : 5382