Ministry of Statistics & Programme Implementation
QUARTERLY ESTIMATES OF GROSS DOMESTIC PRODUCT FOR THE FIRST QUARTER (APRIL-JUNE) OF 2026-27
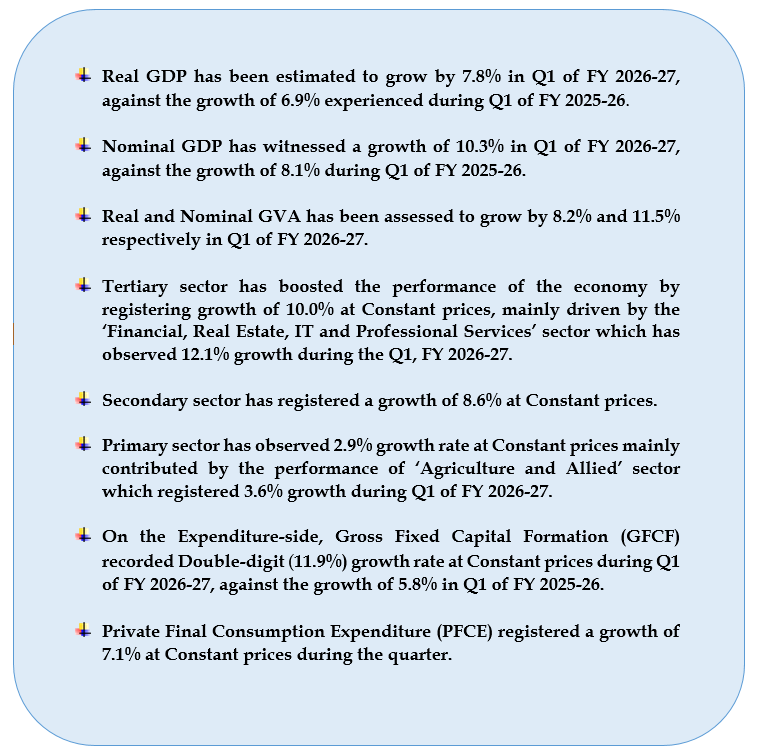
Real GDP during Q1 of FY 2026-27 has observed a growth rate of 7.8%
Nominal GDP has registered 10.3% growth during Q1, FY 2026-27
Indian Economy has sustained Growth Momentum despite Global Headwinds
Posted On:
31 AUG 2026 4:00PM by PIB Delhi
The Ministry of Statistics and Programme Implementation (MoSPI) is releasing in this Press Note, the Quarterly Estimates of Gross Domestic Product (GDP) for the First Quarter (Q1, April-June) of Financial Year (FY) 2026-27 along with its Expenditure components both at Constant (2022-23) and Current prices. The press release is structured as follows,
|
I
|
Quarterly GDP Estimates and Growth Rates
|
|
II
|
Methodology and Major Data Sources
|
|
III
|
Statements:
|
|
Annexure
|
|
The Ministry has released the New Series of Annual and Quarterly GDP estimates with base year 2022-23 on 27th February, 2026 and subsequently Provisional Estimates of GDP for 2025-26 was released on 5th June, 2026. The National Accounts Statistics (NAS) publication released today (https://mospi.gov.in/publications-reports/innerpage/2861), publishes the updated Annual Revised Estimates for the FY 2022-23, 2023-24 and 2024-25 using New Series of Output Producer Price Index (PPI); Banking Services Price Index (BkSPI) with the base year 2022-23 and updated data from various administrative sources.
Similarly, the Quarterly estimates of GDP from Q1 of 2022-23 to Q4 of 2025-26, along with Provisional Estimates of GDP for the FY 2025-26 has been updated and released in the NAS publication. These Quarterly and Provisional Estimates of GDP and other aggregates have now incorporated the New series of Output PPI, Index of Industrial Production (IIP) with base year 2022-23 and updated administrative data from different sources.
Note: -
-
This Press Release is also available at the Ministry’s Website -http://www.mospi.gov.in.
-
Detailed data pertaining to GDP is available at https://esankhyiki.mospi.gov.in/macroindicators?product=nas
KEY HIGHLIGHTS
I. Quarterly Estimates and Growth Rates
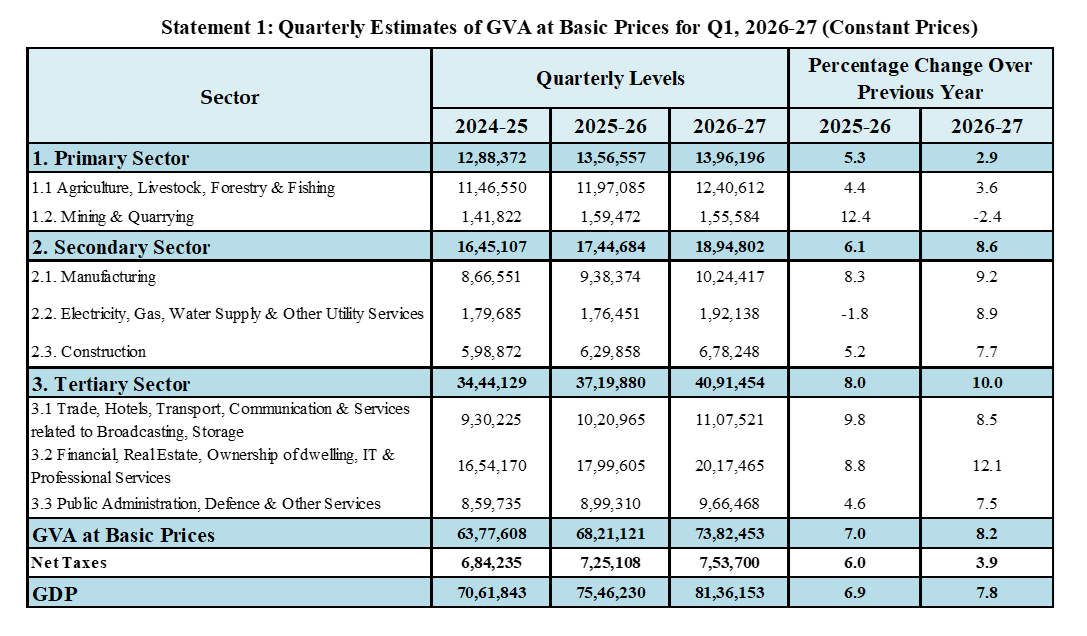
Real GDP or GDP at Constant Prices in Q1 of FY 2026-27 is estimated at ₹81.36 lakh crore, against ₹75.46 lakh crore in Q1 of FY 2025-26, showing a growth rate of 7.8%. Nominal GDP or GDP at Current Prices in Q1 of FY 2026-27 is estimated at ₹88.27 lakh crore, against ₹80.00 lakh crore in Q1 of FY 2025-26, showing a growth rate of 10.3%.
Real GVA in Q1 of FY 2026-27 is estimated at ₹73.82 lakh crore, against ₹68.21 lakh crore in Q1 of FY 2025-26, showing a growth rate of 8.2%. Nominal GVA in Q1 of FY 2026-27 is estimated at ₹80.53 lakh crore, against ₹72.24 lakh crore in Q1 of FY 2025-26, showing a growth rate of 11.5%.
Fig. 1: Quarterly GDP and GVA Estimates along with Y-o-Y Growth Rates at Constant Prices
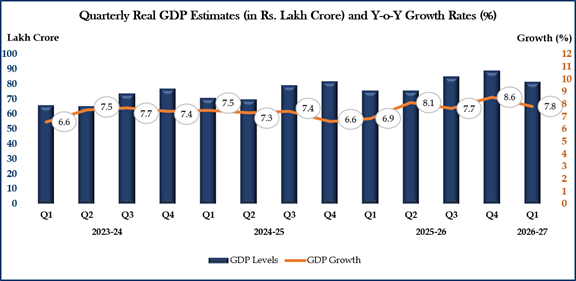
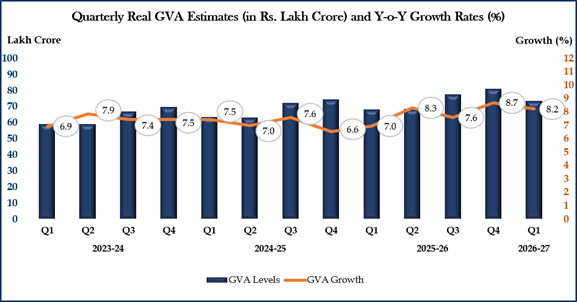
Fig. 2: Sectoral Composition and Growth Rates of Quarterly GVA
Sectoral Composition of Nominal GVA in Q1 of FY 2026-27
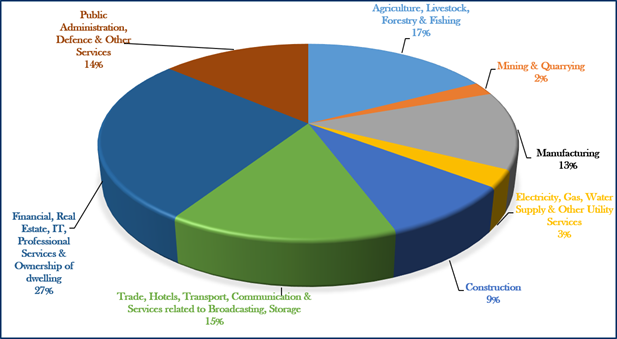
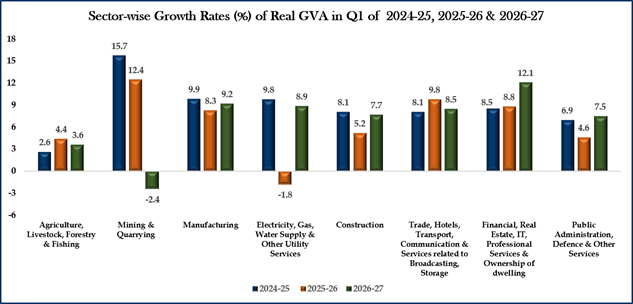
*Public Administration, Defence & Other Services category includes the Other Services sector i.e. Education, Health, Recreation, and other personal services
Fig. 3: Composition and Growth Rates of Quarterly GVA in Broad Sectors
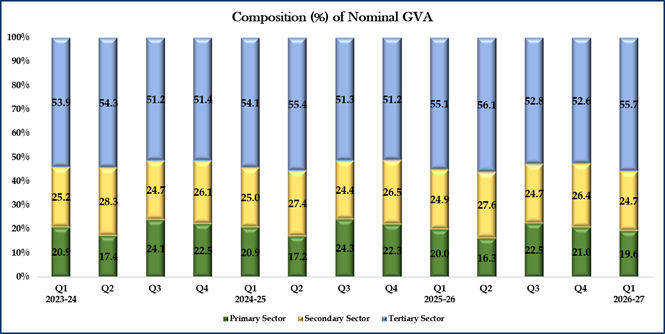
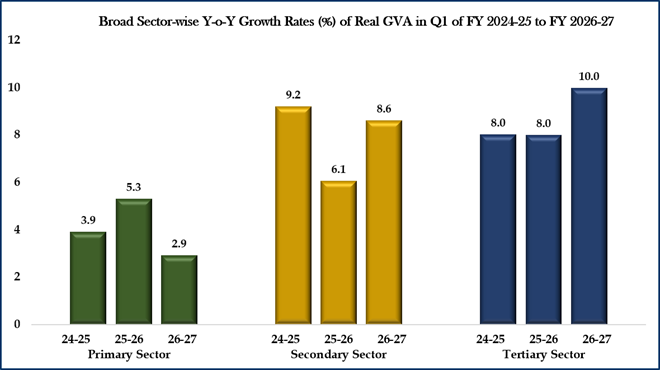
[Primary Sector: Agriculture, Livestock, Forestry & Fishing and Mining & Quarrying
Secondary Sector: Manufacturing; Electricity, Gas, Water supply & Other Utility Services and Construction
Tertiary Sector: Trade, Hotels, Transport, Communication and Services related to Broadcasting, Storage; Financial, Real Estate, IT, & Professional Services, Ownership of Dwelling and Public Administration, Defence & Other Services]
II. Methodology and Major Data Sources:
The compilation of Quarterly Estimates of GDP is based on Benchmark-Indicator methodology in which the estimates computed for the previous financial year are extrapolated using the relevant indicators reflecting the performance of various economic and institutional sectors. The estimates of Quarterly GDP as per base year 2022-23 majorly follow the guidelines, standards as mentioned in Quarterly National Accounts Manual of International Monetary Fund (IMF), 2017. A brief of Revised Methodology, Data Sources, and Deflation strategy in the new series of Quarterly GDP estimates with base year 2022-23 has been provided in the Press Note released on February, 2026.
The new series of National Accounts Statistics has adopted the Double Deflation approach for estimating the GVA of the Manufacturing sector. Under this approach, Output and Intermediate Consumption are separately deflated using concerned Producer Price Indices (PPIs), and real GVA is obtained as the difference between real output and real intermediate consumption. This provides a more robust measure of the real value added by the manufacturing sector by appropriately capturing changes in the prices of both output and inputs compared to the single deflator approach followed in previous series where same deflator were used for both output and intermediate consumption. The availability of improved price data, including the new series of the Producer Price Index (PPI), has further strengthened the implementation of double deflation in the manufacturing sector. It may, however, be noted that under the double deflation approach, the implicit price deflator for manufacturing GVA may decline, or even show a negative growth rate despite an increase in both output and input prices. Such position may occur when input prices (of key input items such as Crude petroleum, natural gas, raw materials, etc.) increase faster than output prices, the price component of value added can decline due to real-world supply-side shocks and shifting margin pressures across economic sectors, resulting in a negative growth in the implicit GVA deflator. Such instances have been experienced in various countries when international supply chains fluctuate.
The Methodology and data sources used in the compilation will be presented comprehensively in the publication ‘Sources and Methods’ scheduled for its release by September, 2026.
The major indicators along with price indices used for the compilation of GDP are listed as follows:
Production-side Indicators and Price Indices:
-
Advance Estimates of Crop Production
-
Production of Inland and Marine Fish
-
Season-wise Production of Major Livestock Products
-
Granular level Index of Industrial Production (IIP)
-
Consumption of Natural Gas
-
Financial Results of Listed Companies in BSE/NSE
-
GST data
-
Consumption of Steel
-
Domestic Sales of Commercial Vehicles and Three Wheelers
-
Domestic and International Air Traffic Statistics
-
Railway Net Tonne, Passenger Km., Goods and Passenger earning information
-
Cargo Handled at Major and Minor Ports
-
Wireless Data Usage, Minutes of Usage, Internet Telephony, Telephone Subscribers, Revenue share from Calls and Data usage information
-
Bank-wise Loan, Deposit, Interest information
-
Loan, Deposit, Interest information of Non-Banking Financial Corporations
-
Information on Revenue Account, Profit-Loss Account, Operating Expenses for Life and Non-Life Insurance companies
-
Public Financial Management System (PFMS) data of Central Government
-
Taxes, Subsidy information of State Governments from CAG
-
Taxes, Subsidy information of Central Government from CGA
-
Granular level Consumer Price Index (CPI) and CPI (Industrial Workers)
-
Granular level output Producer Price Index (PPI)
Expenditure-side Indicators and Price Indices:
-
Vehicle category and class-wise Registration (from e-VAHAN) and Sales information
-
Granular level Index of Industrial Production (IIP)
-
Public Financial Management System (PFMS) data of Central Government
-
Salary information of State Governments from CAG
-
Principal Commodity and HSN-wise Import and Export of Goods
-
Food Grain Offtake information
-
Granular level Consumer Price Index (CPI) and CPI (Industrial Workers)
-
Granular level output Producer Price Index (PPI)
-
Principal Commodity-wise Unit Value Index (UVI)
Improved data coverage and revision in input data made by source agencies would have a bearing on subsequent revisions of the estimates. Estimates are, therefore, likely to undergo revisions for the aforesaid causes in due course, as per the release calendar. Users should take these into consideration while interpreting the figures. The next release of Quarterly GDP estimates for the Second Quarter (July-September) of FY 2026-27 (Q2, 2026-27) is scheduled on 30th November, 2026.
III. Statements
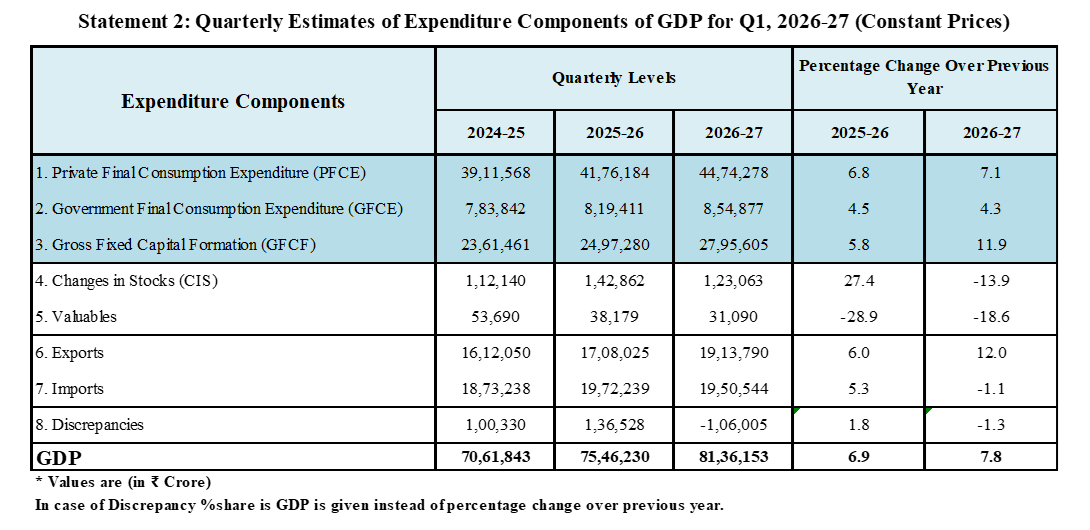
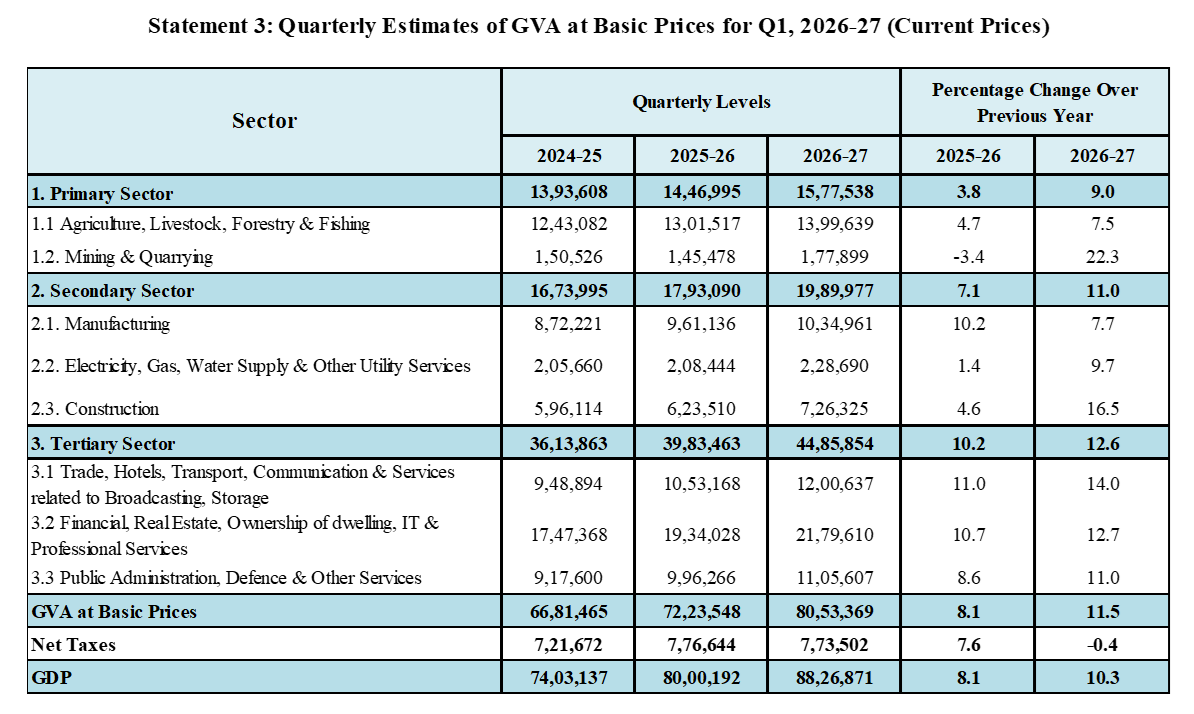
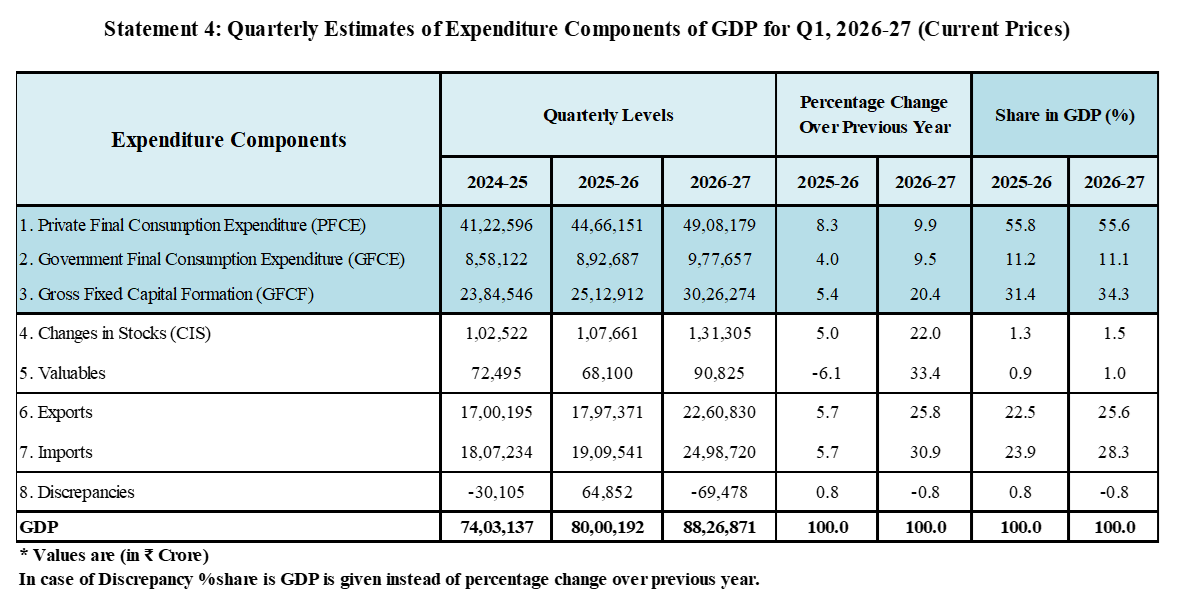
Annexure
Year-on-Year Growth Rate (%) in Indicators
|
Indicators
|
2025-26
|
2026-27
|
|
Q1
|
Q1
|
|
Total Foodgrain
|
5.0
|
4.8
|
|
Rice
|
10.6
|
6.2
|
|
Wheat
|
3.1
|
0.5
|
|
Cement Production Index
|
7.3
|
8.9
|
|
Finished Steel Consumption
|
8.0
|
8.3
|
|
IIP Infrastructure/ Construction Goods
|
6.1
|
7.2
|
|
IIP Electricity
|
-1.5
|
9.3
|
|
IIP Fuel Minerals
|
-1.9
|
-4.5
|
|
IIP Minning & Quarrying
|
3.5
|
-1.2
|
|
Natural Gas Consumption
|
-8.7
|
-2.6
|
|
Sales of Commercial Vehicles
|
-0.3
|
18.3
|
|
Sales of Three Wheelers
|
0.1
|
29.7
|
|
Cargo Handled at Major Ports
|
5.4
|
6.2
|
|
Cargo Handled at Minor Ports
|
0.3
|
-0.6
|
|
Air Passenger Traffic and Cargo handled (Scheduled Domestic Service)
|
6.7
|
2.9
|
|
Air Passenger Traffic and Cargo handled (Scheduled International Service)
|
8.4
|
-19.5
|
|
Railway Net Tonne Km
|
0.5
|
-0.7
|
|
Railway Passenger Km.
|
3.0
|
8.3
|
|
Net Central Goods and Services Tax (CGST)
|
7.8
|
4.8
|
|
Custom Duty
|
-9.9
|
36.1
|
|
Union Excise
|
8.3
|
-22.4
|
|
Fertilizer Subsidy (Urea + Nutrient Based Fertilizer)
|
47.4
|
57.6
|
|
Household Vehicle Registration
|
8.7
|
15.9
|
|
Passenger Transport Vehicle Registration
|
11.2
|
13.9
|
|
Goods Transport Vehicles Registration
|
6.1
|
20.1
|
|
IIP Capital Goods
|
8.8
|
15.2
|
|
IIP (Manufacture of Other Transport Equipment
|
3.8
|
19.5
|
Year-on-Year Growth Rate (%) in Indicators …contd.
|
Indicators
|
2025-26
|
2026-27
|
|
Q1
|
Q1
|
|
IIP Manufacture of computer, electronic and optical products
|
8.8
|
12.4
|
|
IIP Manufacture of Electrical Equipment
|
9.7
|
27.0
|
|
IIP Manufacture of machinery and equipment n.e.c.
|
6.6
|
9.1
|
|
Export of Goods and Services
|
5.7
|
25.8
|
|
Import of Goods and Services
|
5.9
|
30.5
|
|
Import of Transport Goods
|
-22.5
|
13.5
|
|
Import of Machinery Equipment
|
16.5
|
51.5
|
|
Export of Transport Goods
|
-7.2
|
52.2
|
|
Export of Machinery Equipment
|
37.2
|
31.9
|
|
PPI for Agriculture, Forestry and Fishing
|
-1.3
|
4.98
|
|
PPI for Mining & Quarrying
|
-1.96
|
19.5
|
|
PPI for Crude Petroleum and Natural Gas
|
-15.9
|
58.0
|
|
PPI for Manufactured Products
|
0.9
|
10.7
|
|
PPI for Electricity
|
0.6
|
-1.2
|
*IIP and PPI is with the Base Year 2022-23
Click here to see pdf
*****
Samrat
(Release ID: 2304949)
Visitor Counter : 17347