Ministry of Statistics & Programme Implementation
Findings of the Forward-Looking Survey on Private Sector CAPEX Investment Intentions
(Survey period: November 2024 to January 2025)
Private Corporate Sector CAPEX: Three-Year Trends and Future Outlook:
प्रविष्टि तिथि:
29 APR 2025 4:16PM by PIB Delhi
Key findings:
- The average Gross Fixed Assets per enterprise in the private corporate sector increased from ₹3,151.9 crore in 2021–22 to ₹3,279.4 crore in 2022–23 (4% growth), and further to ₹4,183.3 crore in 2023–24, reflecting a significant 27.5% growth.
- The estimated CAPEX per enterprise for the years 2021–22, 2022–23, and 2023–24 was ₹109.2 crore, ₹148.8 crore and ₹107.6 crore respectively.
- The estimated provisional capital expenditure per enterprise for purchasing new assets in 2024–25 is ₹172.2 crore.
- Overall increase of 66.3% in aggregate CAPEX (unweighted) over the four-year period from 2021-22 to 2024-25.
- The strategy of 40.3% of enterprises is to undertake CAPEX on core assets during 2024–25, followed by 28.4% to invest in value addition to existing assets
Survey Background:
In 2022–23, the Parliamentary Standing Committee recommended that the Ministry of Statistics and Programme Implementation (MoSPI) develop a comprehensive methodology to capture capital expenditure (CAPEX) data from the private sector. Survey instruments designed to capture data on past investments, projected CAPEX for the next two years, and the breakdown of investments by asset type were developed in alignment with the specifications of the Department of Economic Affairs (DEA), Ministry of Finance.
Responding to this recommendation, the National Statistical Office (NSO) conducted the inaugural Forward-Looking Survey on Private Sector CAPEX Investment Intentions between November 2024 and January 2025. This marked the first initiative of MoSPI to engage the corporate sector through a self-administered, web-based survey platform, supported by chatbot assistance, to collect structured CAPEX data. MoSPI has released the findings of the survey in the form of a comprehensive booklet. A brief overview of key aspects, such as survey coverage, sampling methodology, and data collection process, is included in the Endnote.
The primary objective of the CAPEX survey is to estimate the CAPEX trends of private corporate sector enterprises from the past three financial years (2021-22, 2022-23 & 2023-24) along with anticipated capital expenditure for the current year (2024-25) and upcoming financial years (2025-26).
Key advantages of the Survey:
Capital expenditure (CAPEX) plays a crucial role in contributing to national investment and enhancing the stock of physical assets within the economy. It leads to the creation of long-term assets, which not only generate revenue for many years but also improve the overall operational efficiency of economic activities. CAPEX is fundamental to expanding production capacity, thereby serving as a catalyst for accelerated economic growth. This growth, in turn, supports job creation and enhances labour productivity.
Comprehensive data on CAPEX will be a valuable asset for a wide range of stakeholders, including government departments, private enterprises, trade associations, researchers, and other relevant entities. It will enable evidence-based policy formulation through the analysis of trends in future investments. Furthermore, a clear understanding of CAPEX patterns and scale can assist enterprises in making strategic, data-driven investment decisions, guided by the insights derived from survey findings.
Important Caveat:
In this inaugural edition of the survey, industry participation varied, with an overall response rate of 58.3% (58.6% in the census sector and 57.2% in the sample sector). Respondents appeared cautious in disclosing CAPEX plans, often pending management approvals. Certain entities, such as Special Purpose Vehicles (SPVs) involved in infrastructure projects, were excluded from the survey frame as they report no turnover despite high CAPEX. Meanwhile, some included SPVs had no future investment plans due to project completion. As this is the first round of the survey, the findings may be seen as indicative and subject to refinement in future iterations. It is also important to note that the results reflect responses from larger enterprises above specified turnover thresholds and may not represent the entire private corporate sector. Users are advised to interpret the results keeping these limitations in mind.
Insights and Way Forward for Future Survey Conduct
The Forward-Looking Survey on Private Sector Capex Investment Intentions, the first of its kind by the NSO, was conducted under the Collection of Statistics Act, 2008. Notices were issued to selected enterprises, explaining the survey's objectives and assuring confidentiality. However, some enterprises questioned the legitimacy of notices containing portal credentials, leading to multiple cyber risk concerns. Explaining portal usage and submission procedures over the phone was challenging. Data analysis revealed issues such as incorrect unit entries (e.g., Rupees instead of Rupees thousands) and non-responses to follow-up queries. Enterprises also faced difficulties in selecting correct NIC codes and estimating future investments when official data was unavailable.
CAPEX tends to rise when enterprises pursue growth strategies rather than maintain current operations. Despite challenges like weak demand, geopolitical tensions, and high borrowing costs, about 30% of firms plan to invest in upgradation in 2024–25, supporting the sharp increase in CAPEX for that year. The slightly lower intended CAPEX for 2025–26, though still above 2023–24 levels, reflects cautious planning after a strong 2024–25. Overall, the trend indicates growing corporate confidence and a judicious approach to investment amid improving economic certainty.
While the response rate and results were generally promising, this initial round of the survey can be considered as an experimental phase, providing valuable insights to refine the questionnaire, methodology, estimation processes, and overall implementation. The lessons learned will guide improvements for future surveys, with necessary adjustments to various aspects of the survey process. Moving forward, responding enterprises will be engaged more proactively before the survey, with concerns about the authenticity of the online survey being addressed, assistance provided in understanding the questionnaire, confidentiality of individual responses ensured, and field personnel deployed to support enterprises in overcoming technical and conceptual challenges in completing future-oriented surveys. Additionally, the survey will incorporate qualitative inputs, such as reasons for year-on-year changes in investment, to gain deeper insights into enterprise-level CAPEX intentions and trends. The next round of the CAPEX survey is expected to be conducted during October to December 2025.
Key highlights from the CAPEX results:
Aggregated (Unweighted, i.e. without applying any multiplier) CAPEX during (2021-22 to 2025-26)
A total of 2,172 enterprises submitted complete information for all five years of the reference period, forming a fixed panel. The aggregated (unweighted) CAPEX data from this panel of enterprises serves as a reliable basis for analyzing capital expenditure trends over the five-year period, as presented below. The results show an overall increase of 66.3% in aggregate CAPEX (unweighted) over the four-year period from 2021-22 to 2024-25.:
(in ₹ Crore)
|
Actual CAPEX in 2021-22
|
Actual CAPEX 2022-23
|
Actual CAPEX 2023-24
|
Intended CAPEX in 2024-25
|
Intended CAPEX in 2025-26
|
|
394,681.5
|
572,199.7
|
422,183.3
|
656,492.7
|
488,865.5
|
Out of the 3,064 responding enterprises, 2,172 reported their Capex intentions for 2025–26. The data indicates a cautious approach by respondents in declaring their capital expenditure plans. Therefore, the Capex data for 2025–26 should be interpreted with caution, considering the conservative approach and apprehension shown by the responding enterprises in reporting these figures. However, the results show an overall increase of 23.9% in aggregate CAPEX (unweighted) during 2021-22 to 2025-26 for this fixed panel of 2,172 enterprises.
Estimated Key Indicators for past years (2021-22 to 2023-24) by Industry of Activity as per National Industry of Classification (Activity Categories)
The average Gross Fixed Asset (GFA) per enterprise in the private corporate sector was estimated at ₹3,151.9 crore in 2021–22. It increased by 4.0% to ₹3,279.4 crores in 2022–23, and further grew by 27.5% to reach ₹4,183.3 crore in 2023–24.
The highest GFA per enterprise, exceeding ₹14,000 crore, was observed in the industry category ‘Electricity, Gas, Steam, and Air Conditioning Supply’, followed by ‘Manufacturing” enterprises (₹7,000 crore to ₹10,000 crore). Enterprises principally engaged in manufacturing activities accounted for more than 65% of the total Gross fixed asset[1] in private corporate sector over the past three years from 2021-22 to 2023-24 followed by enterprises engaged in ‘Electricity, Gas, Steam, and Air Conditioning Supply’ (8%-10%).
In 2021–22, the estimated actual CAPEX per enterprise was ₹109.3 crore, compared to the proposed value of ₹102.7 crore, resulting in a realisation ratio of 106.41 %. A similar trend was observed in 2022–23, where the estimated value of actual CAPEX per enterprise reached ₹148.8 crore against a proposed value of ₹133.3 crore, also yielding a realisation ratio exceeding 100%. For 2023–24, the realisation ratio stands at 99.7%, with the estimated actual CAPEX per enterprise at ₹107.6 and the proposed CAPEX at ₹107.9.
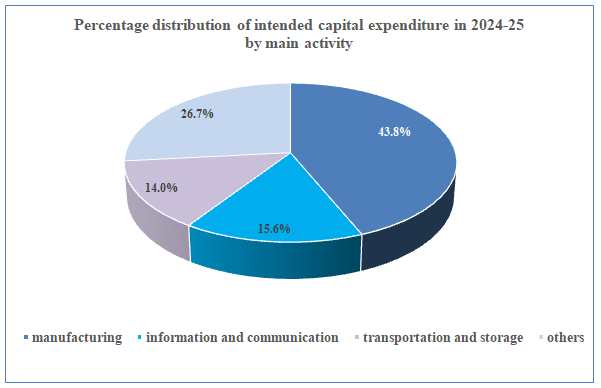
The estimated provisional capital expenditure per enterprise for acquiring new assets in 2024–25 stands at ₹172.2 crore. Among the sectors, manufacturing enterprises account for the largest share at 43.8%, followed by those in ‘Information and Communication Activities’ (15.6%) and ‘Transportation and Storage Activities’ (14.0%).
Estimated Key Indicators for 2023-24 by Asset Groups
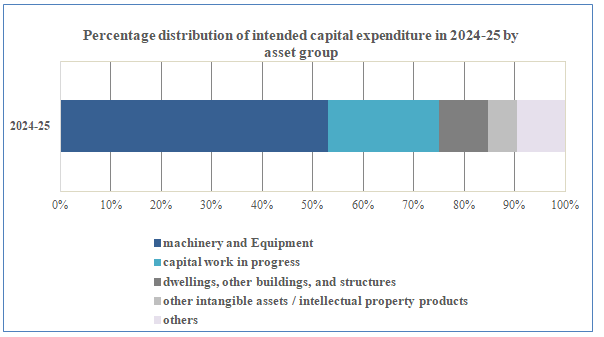
The estimated provisional capital expenditure per enterprise for acquiring new assets in 2024–25 stands at ₹172.2 crore. Out of the total capital expenditure provisionally incurred in the year 2024-25, nearly 53.1% were utilized for purchasing machinery & equipment. The amount allocated for ‘capital work in progress’ (22.0%) and purchasing ‘dwellings, other buildings and structures’ (9.7%) had the next highest share of allocation.
Strategy of CAPEX in 2024-25
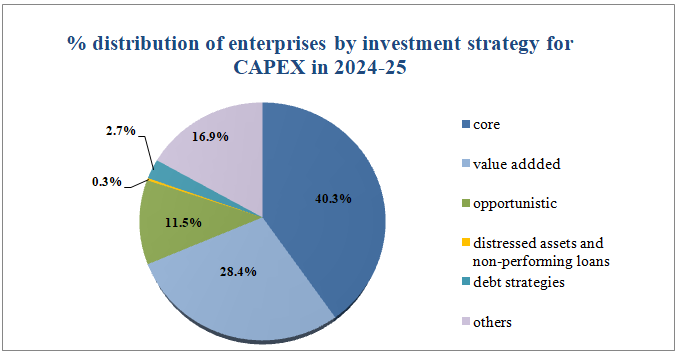
According to survey estimates, nearly 40.3% of enterprises plan to undertake CAPEX on core assets during 2024–25. Additionally, 28.4% intend to invest in value addition to existing assets, while around 11.5% focus on opportunistic assets, and 2.7% on debt strategies. The strategy of investing in distressed assets and non-performing loans was adopted by less than one-half of a percent of enterprises. Meanwhile, about 16.9% allocated their CAPEX towards other diverse investment strategies.
Objectives of CAPEX in 2024-25
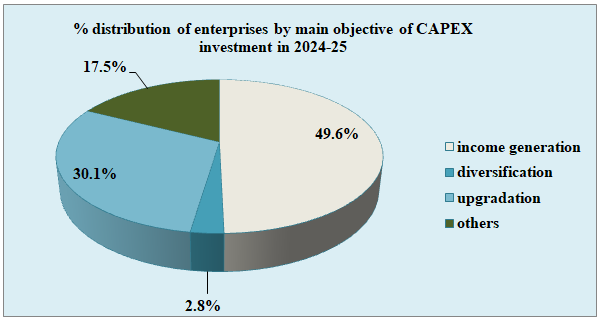
The survey estimates indicate that nearly 49.6% of private corporate sector enterprises undertook CAPEX in 2024–25 primarily for income generation. An additional 30.1% directed their investments toward upgradation, while around 2.8% focused on diversification. Remaining 17.5% of enterprises reported using their CAPEX for other reasons.
The results of CAPEX survey are provided in the booklet which is available in the website of the Ministry (https://www.mospi.gov.in). To protect the confidentiality of CAPEX investment plans of individual enterprises, the Steering Committee of NSS Surveys recommended that unit-level data of CAPEX survey would not be disseminated.
Endnote: A brief about the coverage, sampling scheme, sample size and data collection mechanism in the Forward-Looking Survey on Private Sector CAPEX Investment Intentions:
A. Coverage:
The survey covered large private corporate sector enterprises that play a significant role in their respective sectors. The sampling frame was madeusing data from active enterprises registered with the Ministry of Corporate Affairs (MCA), filtered based on annual turnover thresholds achieved in at least one of the last three financial years. The eligibility criteria were as follows:
- Manufacturing enterprises with an annual turnover of ₹400 crore or more
- Trade enterprises with an annual turnover of ₹300 crore or more
- Other enterprises with an annual turnover of ₹100 crore or more
Based on these criteria, the final survey frame consisted of 16,025 enterprises.
B. Sampling Scheme:
Eligible enterprises were initially categorized into seventeen (17) strata based on their Principal Business Activity as reported in the MGT-7 Form of the Ministry of Corporate Affairs (MCA). In strata with 100 or fewer enterprises, all units were included in the Census Sector for complete enumeration.
For strata with more than 100 enterprises, the selection process involved identifying Census Sector Enterprises and Sample Sector Enterprises. To determine the Census Sector, enterprises were ranked in descending order based on (i) the highest fixed asset value in the past three years and (ii) the fixed asset value of latest reported year. The top enterprises accounting for 90% of asset value (or 80% for Construction and Trade) from either list were classified as Census Sector Enterprises. The remaining units formed the Sample Sector, from which 10% were randomly selected using Simple Random Sampling without Replacement (SRSWOR), with allocation proportional to each stratum’s size and variation.
C. Sample Size:
The sample size for the survey was of 5,380 enterprises: 4,145 enterprises in the Census Sector and 1,235 enterprises in sample sector.
D. Data Collection Mechanism:
The survey was conducted under the provisions of the Collection of Statistics Act, 2008, with prior notices sent to all selected enterprises outlining the survey’s objective and intended use of the data. Confidentiality of individual responses was strictly maintained, and no unit-level data would be disseminated. A secure, dedicated web portal was developed to enable selected enterprises to complete and submit the survey questionnaire online. The portal included background information on the survey, reasons for a unit’s selection, and chatbot support to assist respondents in understanding key concepts and definitions.
*****
Samrat/Allen
(रिलीज़ आईडी: 2125175)
आगंतुक पटल : 5117