Ministry of Commerce & Industry
India’s total exports estimated to grow at 5.40% in June 2024; Cumulative overall exports during April-June 2024 estimated to grow at 8.60%
Merchandise exports register positive growth of 2.55% at USD 35.20 Billion in June 2024 as compared to USD 34.32 Billion in June 2023; Cumulative value of exports during April-June 2024 stands at USD 109.96 Billion as compared to USD 103.89 Billion during April-June 2023, registering a positive growth of 5.84%
Non-Petroleum & Non-Gems & Jewellery exports register an increase of 8.48% from USD 25.29 Billion in June 2023 to USD 27.43 Billion in June 2024
Major drivers of merchandise exports growth in June 2024 include Engineering Goods, Electronic Goods, Drugs & Pharmaceuticals, Coffee and Organic & Inorganic Chemicals
Engineering Goods exports increase by 10.27% from USD 8.52 Billion in June 2023 to USD 9.39 Billion in June 2024
Electronic goods exports increase by 16.91% from USD 2.42 Billion in June 2023 to USD 2.82 Billion in June 2024
Drugs and pharmaceutical exports increase by 9.93% from USD 2.25 Billion in June 2023 to USD 2.47 Billion in June 2024
Coffee exports increase by 70.02% from USD 0.12 Billion in June 2023 to USD 0.20 Billion in June 2024
Organic & Inorganic Chemicals exports increase by 3.32% from USD 2.22 Billion in June 2023 to USD 2.29 Billion in June 2024
प्रविष्टि तिथि:
15 JUL 2024 3:12PM by PIB Delhi
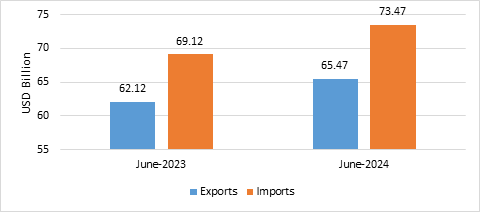
- India’s total exports (Merchandise and Services combined) for June 2024* is estimated at USD 65.47 Billion, registering a positive growth of 5.40 percent vis-à-vis June 2023. Total imports (Merchandise and Services combined) for June 2024* is estimated at USD 73.47 Billion, registering a positive growth of 6.29 percent vis-à-vis June 2023.
Table 1: Trade during June 2024*
|
|
|
June 2024
(USD Billion)
|
June 2023
(USD Billion)
|
|
Merchandise
|
Exports
|
35.20
|
34.32
|
|
Imports
|
56.18
|
53.51
|
|
Services*
|
Exports
|
30.27
|
27.79
|
|
Imports
|
17.29
|
15.61
|
|
Total Trade
(Merchandise +Services) *
|
Exports
|
65.47
|
62.12
|
|
Imports
|
73.47
|
69.12
|
|
Trade Balance
|
-8.00
|
-7.00
|
* Note: The latest data for services sector released by RBI is for May 2024. The data for June 2024 is an estimation, which will be revised based on RBI’s subsequent release.
Fig 1: Total Trade during June 2024*
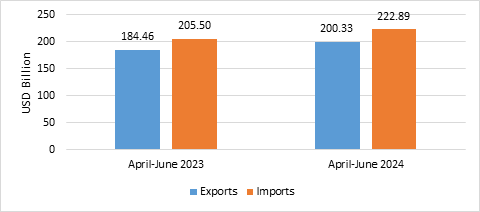
- India’s total exports during April-June 2024* is estimated at USD 200.33 Billion registering a positive growth of 8.60 percent. Total imports during April-June 2024* is estimated at USD 222.89 Billion registering a growth of 8.47 percent.
Table 2: Trade during April-June 2024*
|
|
|
April-June 2024
(USD Billion)
|
April-June 2023
(USD Billion)
|
|
Merchandise
|
Exports
|
109.96
|
103.89
|
|
Imports
|
172.23
|
160.05
|
|
Services*
|
Exports
|
90.37
|
80.57
|
|
Imports
|
50.67
|
45.45
|
|
Total Trade
(Merchandise +Services) *
|
Exports
|
200.33
|
184.46
|
|
Imports
|
222.89
|
205.50
|
|
Trade Balance
|
-22.56
|
-21.03
|
Fig 2: Total Trade during April-June 2024*
MERCHANDISE TRADE
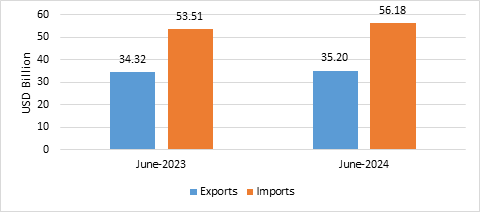
- Merchandise exports during June 2024 were USD 35.20 Billion as compared to USD 34.32 Billion in June 2023.
- Merchandise imports during June 2024 were USD 56.18 Billion as compared to USD 53.51 Billion in June 2023.
Fig 3: Merchandise Trade during June 2024
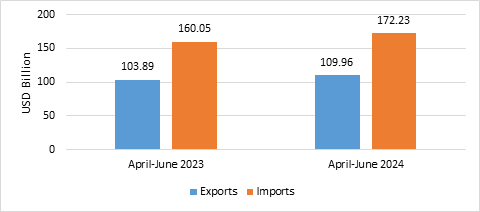
- Merchandise exports during April-June 2024 were USD 109.96 Billion as compared to USD 103.89 Billion during April-June 2023.
- Merchandise imports during April-June 2024 were USD 172.23 Billion compared to USD 160.05 Billion during April-June 2023.
- Merchandise trade deficit during April-June 2024 was USD 62.26 Billion compared to USD 56.16 Billion during April-June 2023.
Fig4: Merchandise Trade during April-June 2024
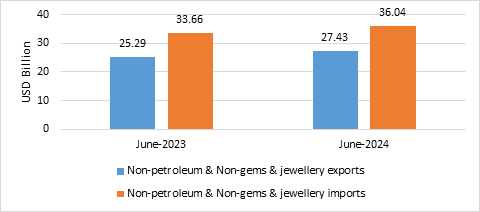
- Non-petroleum and non-gems & jewellery exports in June 2024 were USD 27.43 Billion compared to USD 25.29 Billion in June 2023.
- Non-petroleum, non-gems & jewellery (gold, silver & precious metals) imports in June 2024 were USD 36.04 Billion compared to USD 33.66 Billion in June 2023.
Table 3: Trade excluding Petroleum and Gems & Jewellery during June 2024
|
|
June 2024
(USD Billion)
|
June 2023
(USD Billion)
|
|
Non- petroleum exports
|
29.68
|
27.57
|
|
Non- petroleum imports
|
41.13
|
40.93
|
|
Non-petroleum & Non-Gems & Jewellery exports
|
27.43
|
25.29
|
|
Non-petroleum & Non-Gems & Jewellery imports
|
36.04
|
33.66
|
Note: Gems & Jewellery Imports include Gold, Silver & Pearls, precious & Semi-precious stones
Fig 5: Trade excluding Petroleum and Gems & Jewellery during June 2024
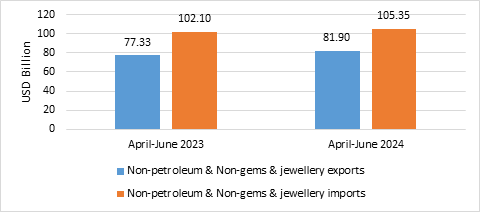
- Non-petroleum and non-gems & jewellery exports in April-June 2024 were USD 81.90 Billion, compared to USD 77.33 Billion in April-June 2023.
- Non-petroleum, non-gems & jewellery (gold, silver & precious metals) imports in April-June 2024 were USD 105.35 Billion, compared to USD 102.10 Billion in April-June 2023.
Table 4: Trade excluding Petroleum and Gems & Jewellery during April-June 2024
|
|
April-June 2024
(USD Billion)
|
April-June 2023
(USD Billion)
|
|
Non- petroleum exports
|
89.17
|
84.86
|
|
Non- petroleum imports
|
120.72
|
118.20
|
|
Non-petroleum & Non Gems & Jewellery exports
|
81.90
|
77.33
|
|
Non-petroleum & Non Gems & Jewellery imports
|
105.35
|
102.10
|
Note: Gems & Jewellery Imports include Gold, Silver & Pearls, precious & Semi-precious stones
Fig 6: Trade excluding Petroleum and Gems & Jewellery during April-June 2024
SERVICES TRADE
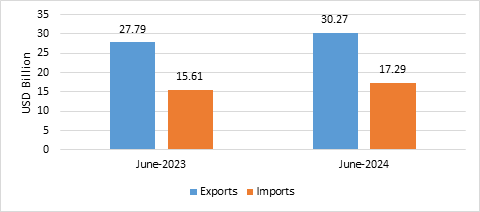
- The estimated value of services export for June 2024* is USD 30.27 Billion as compared to USD 27.79 Billion in June 2023.
- The estimated value of services imports for June 2024* is USD 17.29 Billion as compared to USD 15.61 Billion in June 2023.
Fig 7: Services Trade during June 2024*
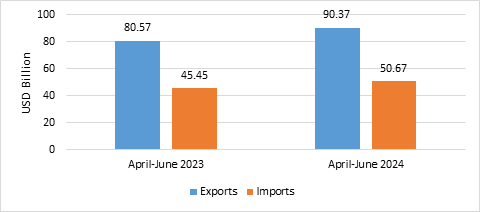
- The estimated value of service exports during April-June 2024* is USD 90.37 Billion as compared to USD 80.57 Billion in April-June 2023.
- The estimated value of service imports during April-June 2024* is USD 50.67 Billion as compared to USD 45.45 Billion in April-June 2023.
- The services trade surplus for April-June 2024* is USD 39.70 Billion as compared to USD 35.12 Billion in April-June 2023.
Fig 8: Services Trade during April-June 2024*
- Exports of Coffee (70.02%), Tobacco (37.71%), Iron Ore (24.66%), Electronic Goods (16.91%), Cereal Preparations & Miscellaneous Processed Items (15.43%), Carpet (10.64%), Engineering Goods (10.27%), Plastic & Linoleum (9.94%), Drugs & Pharmaceuticals (9.93%), Spices (9.84%), Fruits & Vegetables (6.97%), Mica, Coal & Other Ores, Minerals Including Processed Minerals (4.43%), Rmg Of All Textiles (3.68%), Organic & Inorganic Chemicals (3.32%), Tea (3.2%), Man-Made Yarn/Fabs./Made-Ups Etc. (2.79%), Ceramic Products & Glassware (2.48%), Rice (0.97%), and Cotton Yarn/Fabs./Made-Ups, Handloom Products Etc. (0.92%) record positive growth during June 2024 over the corresponding month of last year.
- Imports of Gold (-38.66%), Fertilisers, Crude & Manufactured (-36.44%), Sulphur & Unroasted Iron Pyrts (-30.55%), Cotton Raw & Waste (-26.16%), Chemical Material & Products (-22.3%), Pearls, Precious & Semi-Precious Stones (-18.91%), Leather & Leather Products (-17.38%), Coal, Coke & Briquettes, Etc. (-16.73%) and Transport Equipment (-5.52%) record negative growth during June 2024 over the corresponding month of last year.
- Services exports is estimated to grow by 12.16 percent during April-June 2024* over April-June 2023.
- Top 5 export destinations, in terms of change in value, exhibiting positive growth in June 2024 vis a vis June 2023 are U S A (5.98%), U Arab Emts (13.81%), Malaysia (93.82%), Bangladesh Pr (25.2%) and Tanzania Rep (59.13%).
- Top 5 export destinations, in terms of change in value, exhibiting positive growth in April-June 2024 vis a vis April-June 2023 are Netherland (41.33%), U S A (10.4%), U Arab Emts (17.62%), Malaysia (81.84%) and Singapore (26.55%).
- Top 5 import sources, in terms of change in value, exhibiting growth in June 2024 vis a vis June 2023 are U Arab Emts (48.15%), China P Rp (18.37%), Russia (18.57%), Indonesia (23.22%) and U S A (10.65%).
- Top 5 import sources, in terms of change in value, exhibiting growth in April-June 2024 vis a vis April-June 2023 are U Arab Emts (35.68%), Russia (19.72%), China P Rp (8.34%), Iraq (27.64%) and Indonesia (17.92%).
*Link for Quick Estimates
***
AD/VN
(रिलीज़ आईडी: 2033324)
आगंतुक पटल : 15548