Ministry of Commerce & Industry
India’s merchandise export in February 2022 increases by 22.36% to USD 33.81 billion over USD 27.63 billion in February 2021
India’s merchandise export in April 2021-February 2022 rises by 45.80% to USD 374.05 billion over USD 256.55 billion in April 2020-February 2021
INDIA’S MERCHANDISE TRADE: Preliminary Data for February 2022
Posted On:
02 MAR 2022 6:45PM by PIB Delhi
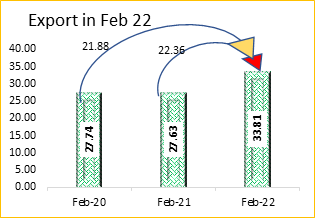
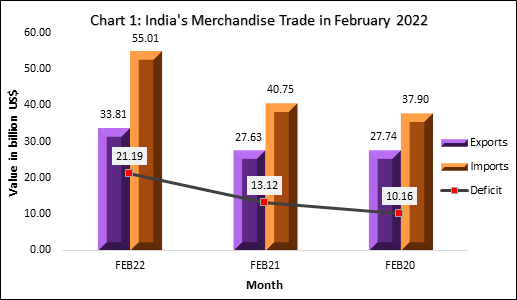
India’s merchandise export in February 2022 was USD 33.81 billion, an increase of 22.36% over USD 27.63 billion in February 2021 and an increase of 21.88% over USD 27.74 billion in February 2020.
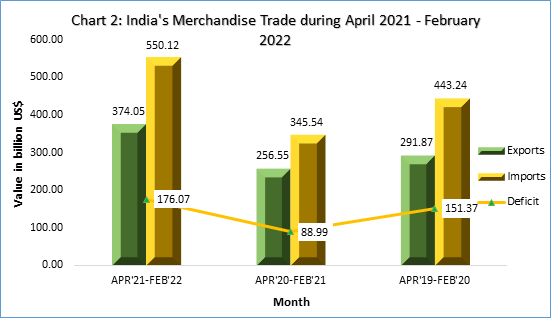
India’s merchandise export in April 2021-February 2022 was USD 374.05 billion, an increase of 45.80% over USD 256.55 billion in April 2020-February 2021 and an increase of 28.16% over USD 291.87 billion in April 2019-February 2020.
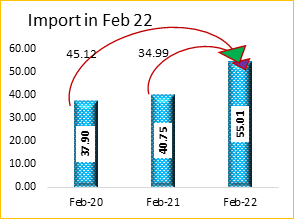
India’s merchandise import in February 2022 was USD 55.01 billion, an increase of 34.99% over USD 40.75 billion in February 2021 and an increase of 45.12% over USD 37.90 billion in February 2020.
India’s merchandise import in April 2021-February 2022 was USD 550.12 billion, an increase of 59.21% over USD 345.54 billion in April 2020-February 2021 and an increase of 24.11% over USD 443.24 billion in April 2019-February 2020.


The trade deficit in February 2022 was USD 21.19 billion, while it was 176.07 billion USD during April 2021-February 2022.
|
Statement 1: India’s Trade in Merchandise goods in February 2022
|
|
|
Value in Billion USD
|
% Growth
|
|
Feb-22
|
Feb-21
|
Feb-20
|
Feb-22 over Feb-21
|
Feb-22 over Feb-20
|
|
Exports
|
33.81
|
27.63
|
27.74
|
22.36
|
21.88
|
|
Imports
|
55.01
|
40.75
|
37.90
|
34.99
|
45.12
|
|
Deficit
|
21.19
|
13.12
|
10.16
|
61.59
|
108.56
|
|
Statement 2: India’s Trade in Merchandise goods in Apr 2021-Feb 2022
|
|
|
Value in Billion USD
|
% Growth
|
|
|
Apr21-Feb22
|
Apr20-Feb21
|
Apr19-Feb20
|
Apr21-Feb 22 over Apr20-Feb 21
|
Apr21-Feb 22 over Apr19-Feb 20
|
|
Exports
|
374.05
|
256.55
|
291.87
|
45.80
|
28.16
|
|
Imports
|
550.12
|
345.54
|
443.24
|
59.21
|
24.11
|
|
Deficit
|
176.07
|
88.99
|
151.37
|
97.86
|
16.32
|


Value of non-petroleum exports in February 2022 was 29.70 USD billion, registering a positive growth of 18.04% over non-petroleum exports of USD 25.16 billion in February 2021 and a positive growth of 22.23% over non-petroleum exports of USD 24.30 billion in February 2020.
Value of non-petroleum imports was USD 39.96 billion in February 2022 with a positive growth of 26.0% over non-petroleum imports of USD 31.72 billion in February 2021 and a positive growth of 47.33% over non-petroleum imports of USD 27.12 billion in February 2020.
|
Statement 3: Merchandise Non-POL Trade in February 2022
|
|
|
Value in Billion USD
|
% Growth
|
|
|
Feb-22
|
Feb-21
|
Feb-20
|
Feb-22 over Feb-21
|
Feb-22 over Feb-20
|
|
Exports
|
29.70
|
25.16
|
24.30
|
18.04
|
22.23
|
|
Imports
|
39.96
|
31.72
|
27.12
|
26.00
|
47.33
|
The cumulative value of non-petroleum exports in April 2021-February 2022 was USD 319.09 billion, an increase of 36.16% over USD 234.36 billion in April 2020-February 2021 and an increase of 26.07% over USD 253.10 billion in April 2019-February 2020.
The cumulative value of non-petroleum imports in April 2021-Feb 2022 was USD 408.63 billion, showing an increase of 49.61% compared to non-oil imports of USD 273.12 billion in April 2020-Feb 2021 and an increase of 26.61% compared to non-oil imports of USD 322.74 billion in April 2019-Feb 2020.
|
Statement 4: Merchandise Non-POL Trade Apr 2021-Feb 2022
|
|
|
Value in Billion USD
|
% Growth
|
|
|
Apr21-Feb22
|
Apr20-Feb21
|
Apr19-Feb20
|
Apr21-Feb 22 over Apr20-Feb 21
|
Apr21-Feb 22 over Apr19-Feb 20
|
|
Exports
|
319.09
|
234.36
|
253.10
|
36.16
|
26.07
|
|
Imports
|
408.63
|
273.12
|
322.74
|
49.61
|
26.61
|
Value of non-petroleum and non-gems and jewellery exports in February 2022 was USD 26.60 billion, registering a positive growth of 18.31% over non-petroleum and non-gems and jewellery exports of USD 22.48 billion in February 2021 and a positive growth of 24.98% over non-petroleum and non-gems and jewellery exports of USD 21.28 billion in February 2020.
Value of non-oil, non-GJ (gold, silver & Precious metals) imports was USD 31.61 billion in February 2022 with a positive growth of 31.66% over non-oil and non-GJ imports of USD 24.01 billion in Feb 2021 and a positive growth of 42.31% over non-oil and non-GJ imports of USD 22.21 billion in Feb 2020.
|
Statement 5: Merchandise Non-POL Non-GJ Trade in February 2022
|
|
|
Value in Billion USD
|
% Growth
|
|
|
Feb-22
|
Feb-21
|
Feb-20
|
Feb-22 over Feb-21
|
Feb-22 over Feb-20
|
|
Exports
|
26.60
|
22.48
|
21.28
|
18.31
|
24.98
|
|
Imports
|
31.61
|
24.01
|
22.21
|
31.66
|
42.31
|
The cumulative value of non-petroleum and non-gems and jewellery exports in April 2021-February 2022 was USD 283.83 billion, an increase of 33.92% over cumulative value of non-petroleum and non-gems and jewellery exports of USD 211.95 billion in April 2020-February 2021 and an increase of 29.47% over cumulative value of non-petroleum and non-gems and jewellery exports of USD 219.22 billion in April 2019-February 2020.
Non-oil, non-GJ (Gold, Silver & Precious Metals) imports was USD 332.85 billion in April 2021-February 2022, recording a positive growth of 44.78%, as compared to non-oil and non-GJ imports of USD 229.89 billion in April 2020-February 2021 and a positive growth of 22.35% over USD 272.05 billion in April 2019-February 2020.
|
Statement 6: Merchandise Non-POL Non-GJ Trade Apr 2021-Feb 2022
|
|
|
Value in Billion USD
|
% Growth
|
|
|
Apr21-Feb22
|
Apr20-Feb21
|
Apr19-Feb20
|
Apr21-Feb 22 over Apr20-Feb 21
|
Apr21-Feb 22 over Apr19-Feb 20
|
|
Exports
|
283.83
|
211.95
|
219.22
|
33.92
|
29.47
|
|
Imports
|
332.85
|
229.89
|
272.05
|
44.78
|
22.35
|
Top 10 major commodity groups covering 80% of total exports in February 2022 are as follows:
|
Statement 7: Exports of Top 10 Major Commodity Groups in February 2022
|
| |
Value of Export (Million US$)
|
Share (%)
|
Growth (%)
|
|
Major Commodity Group
|
Feb-22
|
Feb-21
|
Feb-22
|
Feb-22 over Feb-21
|
|
Engineering goods
|
9272.37
|
7059.91
|
27.42
|
31.34
|
|
Petroleum products
|
4109.38
|
2471.16
|
12.15
|
66.29
|
|
Gems and Jewellery
|
3105.59
|
2682.08
|
9.18
|
15.79
|
|
Organic and Inorganic chemicals
|
2407.81
|
1930.21
|
7.12
|
24.74
|
|
Drugs and Pharmaceuticals
|
1938.79
|
2001.44
|
5.73
|
-3.13
|
|
RMG of all Textiles
|
1598.64
|
1348.55
|
4.73
|
18.54
|
|
Electronic goods
|
1477.76
|
1104.69
|
4.37
|
33.77
|
|
Cotton Yarn/Fabs./Madeups, Handloom products etc.
|
1258.88
|
947.64
|
3.72
|
32.84
|
|
Rice
|
920.67
|
918.94
|
2.72
|
0.19
|
|
Plastic and Linoleum
|
793.34
|
631.19
|
2.35
|
25.69
|
|
Total of 10 Major Commodity Groups
|
26883.24
|
21095.80
|
79.51
|
27.43
|
|
Rest
|
6928.61
|
6537.45
|
20.49
|
5.98
|
|
Total Exports
|
33811.86
|
27633.25
|
100.00
|
22.36
|
Top 10 major commodity groups covering 78% of total imports in February 2022 are as follows:
|
Statement 8: Imports of Top 10 Major Commodity Groups in February 2022
|
| |
Import (Million US$)
|
Share (%)
|
Growth (%)
|
|
Major Commodity Group
|
Feb-22
|
Feb-21
|
Feb-22
|
Feb-22 over Feb-21
|
|
Petroleum, Crude & products
|
15042.44
|
9031.45
|
27.35
|
66.56
|
|
Electronic goods
|
6244.93
|
4843.82
|
11.35
|
28.93
|
|
Gold
|
4684.79
|
5290.40
|
8.52
|
-11.45
|
|
Machinery, electrical & non-electrical
|
3612.66
|
3184.00
|
6.57
|
13.46
|
|
Pearls, precious & Semi-precious stones
|
3186.03
|
2408.50
|
5.79
|
32.28
|
|
Coal, Coke & Briquettes, etc.
|
2860.20
|
1318.11
|
5.20
|
116.99
|
|
Organic & Inorganic Chemicals
|
2434.07
|
2039.23
|
4.43
|
19.36
|
|
Artificial resins, plastic materials, etc.
|
1704.53
|
1458.36
|
3.10
|
16.88
|
|
Fertilisers, Crude & manufactured
|
1670.20
|
224.57
|
3.04
|
643.73
|
|
Iron & Steel
|
1603.74
|
1239.36
|
2.92
|
29.40
|
|
Total of 10 Major Commodity Groups
|
43043.59
|
31037.80
|
78.25
|
38.68
|
|
Rest
|
11961.83
|
9710.85
|
21.75
|
23.18
|
|
Total Imports
|
55005.42
|
40748.65
|
100.00
|
34.99
|
Top 10 major commodity groups covering 80% of total exports in April 2021 –Feb 2022 are as follows:
|
Statement 9: Exports of Top 10 Major Commodity Groups in April 2021-February 2022
|
| |
Value of Export (Million US$)
|
Share (%)
|
Growth (%)
|
|
Major Commodity Group
|
Apr21-Feb22
|
Apr20-Feb21
|
Apr21-Feb22
|
Apr21-Feb22 over Apr20-Feb21
|
|
Engineering goods
|
100927.31
|
67421.24
|
26.98
|
49.70
|
|
Petroleum products
|
54958.67
|
22195.00
|
14.69
|
147.62
|
|
Gems and Jewellery
|
35258.63
|
22409.82
|
9.43
|
57.34
|
|
Organic and Inorganic chemicals
|
26470.62
|
19799.60
|
7.08
|
33.69
|
|
Drugs and Pharmaceuticals
|
22185.08
|
22148.98
|
5.93
|
0.16
|
|
RMG of all Textiles
|
14273.26
|
10846.26
|
3.82
|
31.60
|
|
Cotton Yarn/Fabs./Madeups, Handloom products etc.
|
13949.35
|
8722.84
|
3.73
|
59.92
|
|
Electronic goods
|
13838.07
|
9692.61
|
3.70
|
42.77
|
|
Plastic and Linoleum
|
8961.25
|
6743.31
|
2.40
|
32.89
|
|
Rice
|
8617.48
|
7712.67
|
2.30
|
11.73
|
|
Total of 10 Major Commodity Groups
|
299439.72
|
197692.35
|
80.05
|
51.47
|
|
Rest
|
74610.74
|
58859.53
|
19.95
|
26.76
|
|
Total Exports
|
374050.47
|
256551.88
|
100.00
|
45.80
|
Top 10 major commodity groups covering 77% of total imports in April 2021 -Feb 2022 are as follows:
|
Statement 10: Imports of Top 10 Major Commodity Groups in April 2021-February 2022
|
| |
Import (Million US$)
|
Share (%)
|
Growth (%)
|
|
Major Commodity Group
|
Apr21-Feb22
|
Apr20-Feb21
|
Apr21-Feb22
|
Apr21-Feb22 over Apr20-Feb21
|
|
Petroleum, Crude & products
|
141486.97
|
72412.48
|
27.35
|
95.39
|
|
Electronic goods
|
64745.48
|
48423.77
|
11.35
|
33.71
|
|
Gold
|
45033.98
|
26110.24
|
8.52
|
72.48
|
|
Machinery, electrical & non-electrical
|
36392.76
|
26570.80
|
6.57
|
36.97
|
|
Pearls, precious & Semi-precious stones
|
27595.98
|
16340.69
|
5.79
|
68.88
|
|
Organic & Inorganic Chemicals
|
27498.42
|
17722.78
|
4.43
|
55.16
|
|
Coal, Coke & Briquettes, etc.
|
27120.61
|
14538.79
|
5.20
|
86.54
|
|
Artificial resins, plastic materials, etc.
|
18238.74
|
11790.09
|
3.10
|
54.70
|
|
Transport equipment
|
18211.83
|
16438.43
|
2.22
|
10.79
|
|
Vegetable Oil
|
17240.22
|
10012.30
|
2.47
|
72.19
|
|
Total of 10 Major Commodity Groups
|
423564.98
|
260360.38
|
77.00
|
62.68
|
|
Rest
|
126552.82
|
85176.63
|
23.00
|
48.58
|
|
Total Imports
|
550117.80
|
345537.01
|
100.00
|
59.21
|
Source: DGCI&S
***
DJN/AM/PK/MS
(Release ID: 1802398)
Visitor Counter : 3108