Ministry of Finance
GEO-SPATIAL DATA AND CARTOGRAPHIC TECHNIQUES TO TRACK, COMPARE AND REPRESENT LONGER TERM DEVELOPMENTS : SURVEY
INFORMATION TO BE USED FROM SATELLITES, DRONES AND MOBILE PHONES ALONGSIDE IMPROVEMENT IN CARTOGRAPHIC TECHNOLOGY
GEOSPATIAL AND CARTOGRAPHIC DATA USED TO ANALYSE PHYSICAL AND FINANCIAL INFRASTRUCTURE DEVELOPMENT IN INDIA
METRO-RAIL NETWORK OF CITIES CAN BE USED FOR TRACKING ECONOMIC ACTIVITY AND DEVELOPMENT
ANNUAL WATER STORAGE CYCLE, POPULATION DENSITY, URBAN EXPANSION AND WASTELAND REDEPLOYMENT ALSO COMPARED IN THE SURVEY
प्रविष्टि तिथि:
31 JAN 2022 3:08PM by PIB Delhi
The usage of new forms of data and information for tracking the economic activity and development is an important theme this year. The Economic Survey for FY 2021-22, tabled in the Parliament today by Union Minister for Finance and Corporate Affairs, Smt. Nirmala Sitharaman, lays emphasis on this approach and mentions that geo-spatial data and cartographic techniques can be used to track, compare and represent longer term developments.
The Survey highlights the importance of Geospatial maps in visualizing data to better understand trends, relationships and patterns. The availability of plethora of information from satellites, drones, mobile phones and other sources alongside a dramatic improvement in cartographic technology allows a better use of this data set for public good..
The Economic Survey illustrates some of the interesting ways of depicting Geo-spatial data:
- Comparison of Night-time luminosity data between 2012 and 2021
It provides an interesting representation of the expansion of electricity supply, the geographical distribution of population and economic activity, urban expansion as well as growth of ribbon developments between urban hubs.
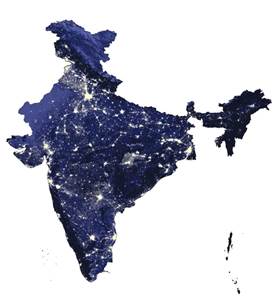
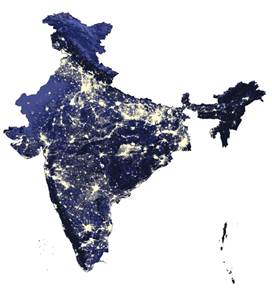 India Night-time Luminosity 2012 India Night-time Luminosity 2021
- Expansion of National Highways
India’s National Highway Network has grown from 71,772 Km in August 2011 to 1,40,152 Km August 2021.
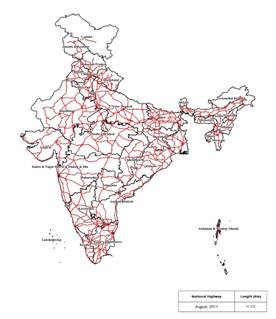
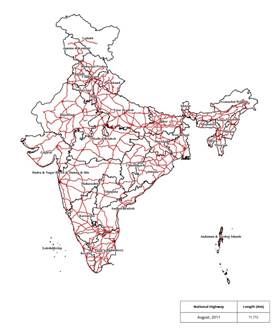
India’s National Highway Network India’s National Highway Network
(As of August 2011) (As of August 2021)
- Comparison of Number of Operationalised Airports in India between 2016 and 2021
The number of Operationalised Airports (Pre-UDAN) has grown from 62 (As of Nov. 2016) to 130 by December 2021.
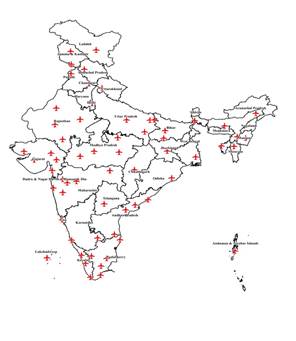
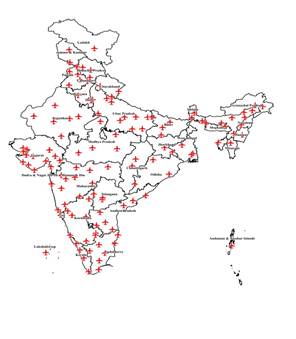 Number of Operationalised Airports (As of Nov. 2016) Number of Operationalised Airports (As of Dec. 2021)
- Comparison of Metro-rail network between 2011 and 2021
The Survey studies the Metro-rail Network of various cities and makes a case for the usage of data for tracking economic activity and development.
- Delhi Metro-rail network between 2011 and 2021
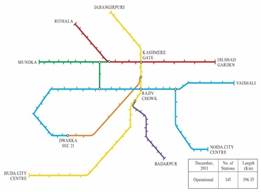
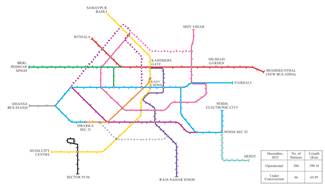
Delhi Metro-rail Network 2011 Delhi Metro-rail Network 2021
The Delhi Metro-rail Network has grown from 145 operational Stations with a length of 196.35 Km (As of Dec. 2011) to 286 operational stations and a length of 390.14 Km (As of Dec. 2021)
- Bangalore Metro-rail network between 2011 and 2021
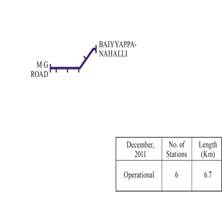
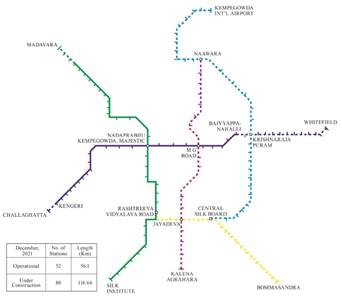
Bangalore Metro-rail Network 2011 Bangalore Metro-rail Network 2021
The Bangalore Metro-rail Network has also grown from just 6 stations being operational with a length of 6.7 km (As of Dec. 2011) to 52 operational stations with a length of 56.2 km (As of Dec. 2021)
The Economic Survey has also presented the data/information using the satellite imaging for Annual water storage, Population densities of various cities, Kharif Crop Cycle and Wasteland redeployment among others to focus on the theme of using “new forms of data and information for tracking economic activity and development.”
RM/RJ/BY/KS
(रिलीज़ आईडी: 1793822)
आगंतुक पटल : 2110