NITI Aayog
NITI Aayog under the Indo-German Cooperation releases inaugural SDG Urban Index and Dashboard 2021–22
Shimla tops the Index followed by Coimbatore and Chandigarh
Total 56 urban areas were considered for computation
Posted On:
23 NOV 2021 3:07PM by PIB Delhi
In its journey towards localizing the Sustainable Development Goals (SDGs) and instituting robust SDG progress monitoring systems at the national, State/UT, and local levels, NITI Aayog has achieved yet another milestone with the launch of the inaugural SDG Urban Index & Dashboard (2021-22) today. The index and dashboard are a result of the NITI Aayog-GIZ and BMZ collaboration focused on driving SDG localization in our cities, under the umbrella of Indo-German Development Cooperation.
The SDG Urban Index and Dashboard ranks 56 urban areason 77 SDG indicators across 46 targets of the SDG framework. The data on these indicators have been sourced from official data sources such as NFHS, NCRB, U-DISE, data portals of various ministries, and other government data sources.
The index and dashboard will further strengthen SDG localization and institute robust SDG monitoring at the city level. It highlights the strengths and gaps of ULB-level data, monitoring, and reporting systems. Tools such as this index and dashboard will contribute to the creation of an ecosystem in which all stakeholders will be equipped to adopt and implement data-driven decision making. This transformative change is quite essential, given the increasing prominence of our cities and urban areas in charting the future of development in India.
Dr Rajiv Kumar, Vice Chairperson, NITI Aayog, Government of India and Prof Dr Claudia Warning, Director General, BMZ, Government of Germany launched the index and dashboard in the presence of Mr Philipp Knill, Head of South Asia Division BMZ; Dr Julie Reviere, Country Director, GIZ India;Mr Georg Jahnsen, Head of Sustainable Development of Smart Cities Project, GIZ India;MsSanyuktaSamaddar, Adviser (SDG), NITI Aayog, and other senior officials from the two sides.
“Cities are fast becoming engines of growth. The SDG Urban index and dashboard, a product of innovative partnership between NITI Aayog and GIZ, will go a long way in instituting a robust SDG monitoring system in our cities, and is a milestone step in our SDG localisation journey,” Dr. Rajiv Kumar, Vice Chairman, NITI Aayog said during the launch.
With one-third of the journey towards achieving the 2030 Agenda behind us, measuring progress on the SDG in urban areas is critical. On this theme, Sanyukta Samaddar, Nodal Officer (SDG), said that NITI Aayog, “seeks to empower local administrations to adopt a measurement-based approach to decision making. Only if the SDG agenda is adopted by the last mile stakeholders can we hope to achieve the global 2030 Agenda. The SDG Urban Index is one more step towards localising the SDGs further.”
On the Indo-German Partnership on Sustainable Development Goals, Prof. Dr. Claudia Warning, DG BMZ said that it will, “focus on deepening SDG localisation and monitoring, and addressing critical gaps in institutional capacity and data systems on SDGs at national and state levels. We look forward to strengthening this partnership with NITI Aayog in building capacities on SDGs.”
Methodology
The statistical methodology for the SDG Urban Index is drawn from the globally accepted methodology developed by the Sustainable Development Solutions Network (SDSN). The methodology, used for the SDG India Index and North Eastern Region District SDG Index as well, was finalised in close collaboration with the Ministry of Statistics and Programme Implementation (MoSPI).A comprehensive list of 77 indicators, covering 46 global SDG targets across 15 SDGs,are used in the index.SDG 14 (life below water) has not been included as it is relevant for only coastal areas, which are only a few of the selected cities, and SDG 17 (partnerships for the goals) has been excluded as the progress of its targets are monitored at the national level. While progress under SDG 15 (life on land) has been measured using two indicators, they have not been used in estimating the scores, owing to lack of adequate coverage.The indicators are aligned with MoSPI’s National Indicator Framework. Relevance to SDG targets and data availability at the urban level are the most important criteria for indicator selection. The most recent data on these indicators have been sourced from various official data sources such as NFHS, NCRB, U-DISE, data portals of ministries, and other government data sources and 62 percent of the indicators are sourced from 2019 or later.
Out of 56 urban areas ranked in the index, 44 are with population of above one million. 12 are State capitals with population of less than a million. While for some indicators, “urban area” implies ULBs, in other cases, it refers to all urban areas within a district collectively. This is owing to the usage of different data sets which have collated urban data at different administrative units. However, for any given indicator, the same definition has been used for all urban areas.
For each SDG, the urban areas are ranked on a scale of 0-100. A score of 100 implies that the urban area has achieved the targets set for 2030; a score of 0 implies that it is the farthest from achieving the targets among the selected urban areas. Overall or composite urban area scores are then generated from the Goal-wise scores to measure aggregate performance of the urban area.
Urban areas have been classified as below based on their composite score:
- Aspirant: 0–49
- Performer: 50–64
- Front-Runner: 65–99
- Achiever: 100
The following 56 urban areas have been considered for computation –44 with population above one million and 12 State capitals with population less than a million:
|
Agartala
|
Gwalior
|
Nashik
|
|
Agra
|
Hyderabad
|
Panaji
|
|
Ahmedabad
|
Imphal
|
Patna
|
|
Aizawl
|
Indore
|
Prayagraj
|
|
Amritsar
|
Itanagar
|
Pune
|
|
Aurangabad
|
Jabalpur
|
Raipur
|
|
Bengaluru
|
Jaipur
|
Rajkot
|
|
Bhopal
|
Jodhpur
|
Ranchi
|
|
Bhubaneswar
|
Kanpur
|
Shillong
|
|
Chandigarh
|
Kochi
|
Shimla
|
|
Chennai
|
Kohima
|
Srinagar
|
|
Coimbatore
|
Kolkata
|
Surat
|
|
Dehradun
|
Kota
|
Tiruchirappalli
|
|
Delhi
|
Lucknow
|
Thiruvananthapuram
|
|
Dhanbad
|
Ludhiana
|
Vadodara
|
|
Faridabad
|
Madurai
|
Varanasi
|
|
Gangtok
|
Meerut
|
Vijayawada
|
|
Ghaziabad
|
Mumbai
|
Visakhapatnam
|
|
Guwahati
|
Nagpur
|
|
Results
Top 10 Urban Areas
|
Urban Area
|
State/UT
|
Composite Score
|
|
Shimla
|
Himachal Pradesh
|
75.50
|
|
Coimbatore
|
Tamil Nadu
|
73.29
|
|
Chandigarh
|
Chandigarh
|
72.36
|
|
THiruvanantHapuram
|
Kerala
|
72.36
|
|
Kochi
|
Kerala
|
72.29
|
|
Panaji
|
Goa
|
71.86
|
|
Pune
|
Maharashtra
|
71.21
|
|
Tiruchirapalli
|
Tamil Nadu
|
70.00
|
|
Ahmedabad
|
Gujarat
|
69.79
|
|
Nagpur
|
Maharashtra
|
69.79
|
Bottom 10 Urban Areas
|
Urban Area
|
State/UT
|
Composite Score
|
|
Faridabad
|
Haryana
|
58.57
|
|
Kolkata
|
West Bengal
|
58.5
|
|
Agra
|
Uttar Pradesh
|
58.21
|
|
Kohima
|
Nagaland
|
58.07
|
|
Jodhpur
|
Rajasthan
|
58
|
|
Patna
|
Bihar
|
57.29
|
|
Guwahati
|
Assam
|
55.79
|
|
Itanagar
|
Arunachal Pradesh
|
55.29
|
|
Meerut
|
Uttar Pradesh
|
54.64
|
|
Dhanbad
|
Jharkhand
|
52.43
|
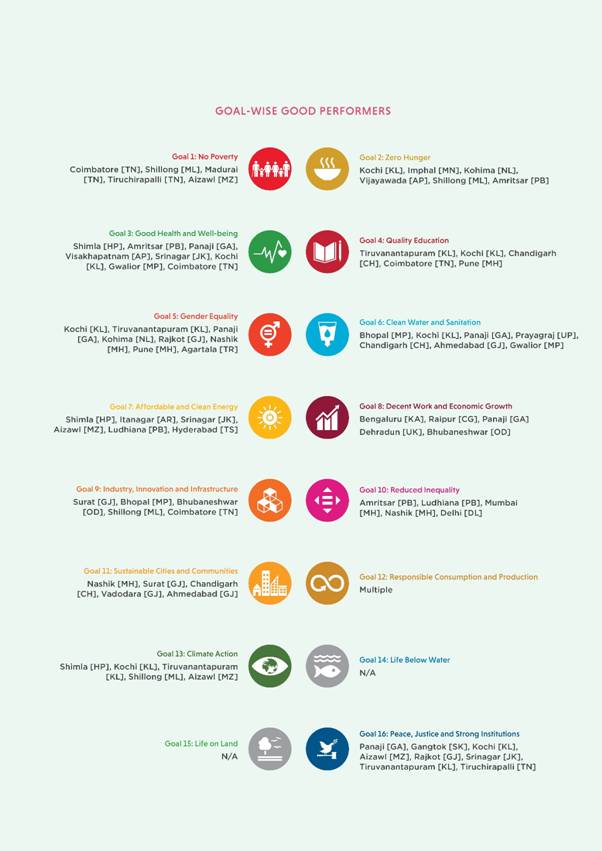
Goal-wise good performing urban areas


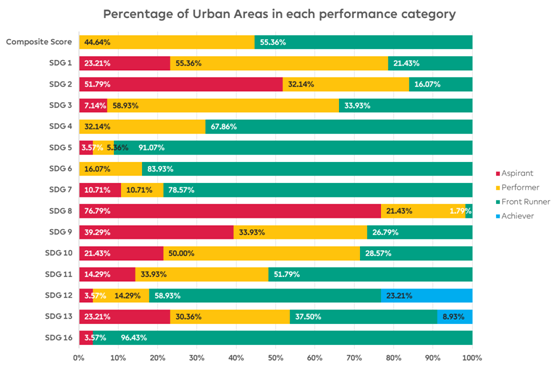
Percentage of urban areas in each performance category
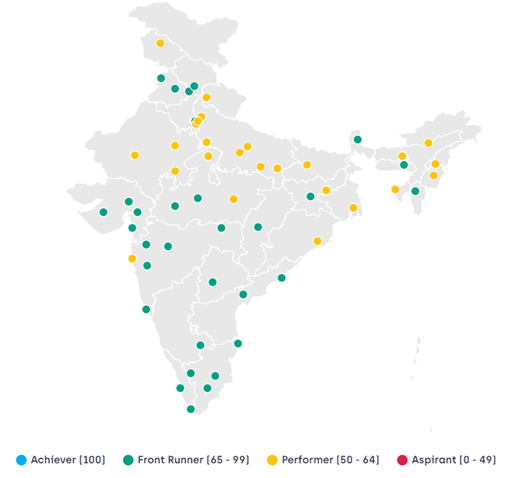
Composite performance of urban areas (geographic distribution)

A snapshot of the SDG Urban Index & Dashboard 2021-22

The interactive dashboard can be accessed here: http://sdgindiaindex.niti.gov.in/urban

Scan the QR to visit the dashboard
*****
DS/AKJ
(Release ID: 1774225)
Visitor Counter : 5856