Ministry of Steel
India’s Steel Sector Continues Its Upward Trajectory in Apr-Jul 2026
Posted On:
25 AUG 2026 1:07PM by PIB Delhi
1. Steel Production & Prices
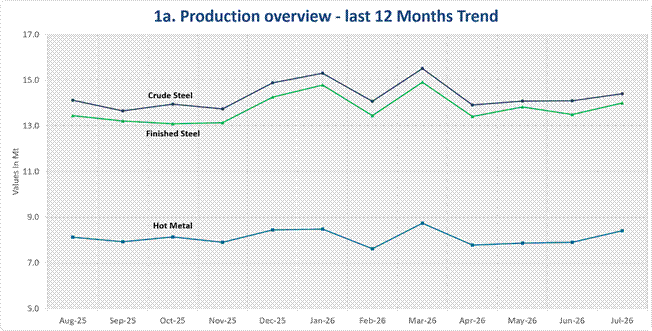
1a. Production Overview (in Mt)
|
Production
|
Jul 2026
|
Jul 2025
|
YoY %
|
Apr-Jul 2026
|
Apr-Jul 2025
|
CPLY %
|
|
Crude Steel
|
14.4
|
14.1
|
1.9
|
56.2
|
54.9
|
2.4
|
|
Hot Metal
|
8.4
|
7.9
|
6.3
|
31.9
|
31.1
|
2.7
|
|
Finished Steel
|
14.0
|
13.5
|
3.9
|
54.7
|
52.2
|
4.7
|
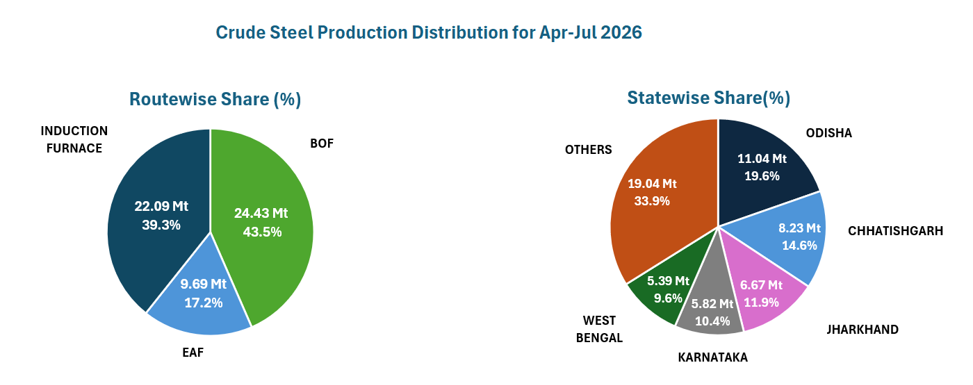
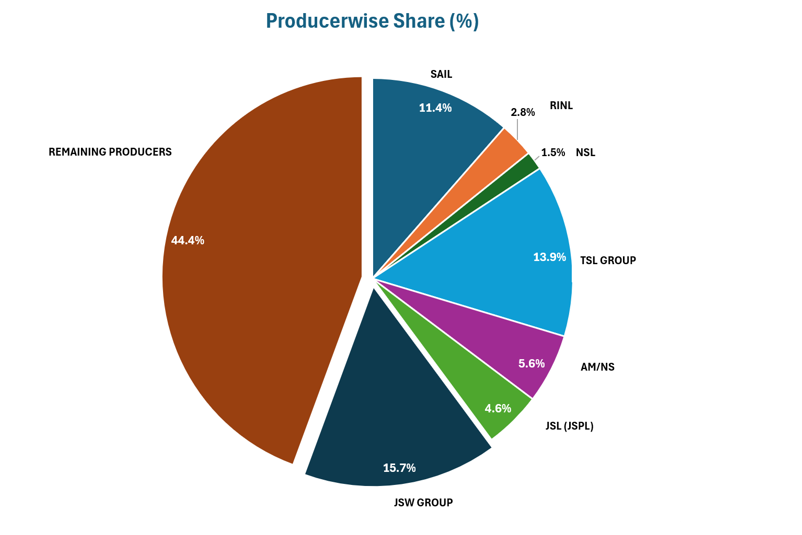
1b. Producer wise Production (Apr-Jul 2026) (in Mt)
|
Producer
|
Annual Crude Steel Capacity
|
Crude Steel Production
|
Hot Metal
Production
|
Finished Steel Production
|
|
Top 7
|
117.4
|
31.3
|
29.7
|
29.3
|
|
Remaining producers
|
105.3
|
24.9
|
2.3
|
25.3
|
|
TOTAL
|
222.7
|
56.2
|
31.9
|
54.7
|
|
Public Sector Share (%)
|
13.9
|
15.8
|
30.0
|
13.4
|
|
Top 7 includes SAIL, RINL, NSL, TSL Group, AM/NS, JSL(JSPL), JSW Group
|
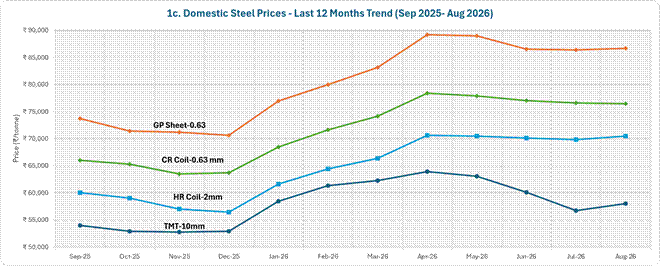
1c. Steel Prices (in ₹/tonne)
|
Product
|
Jun-26
|
Jul-26
|
Aug-26
|
MoM %
|
YoY %
|
|
TMT (10 mm)
|
₹ 60,068
|
₹ 56,698
|
₹ 58,003
|
2.3%
|
5.8%
|
|
HR Coil (2 mm)
|
₹ 70,108
|
₹ 69,828
|
₹ 70,448
|
0.9%
|
15.5%
|
|
CR Coil (0.63 mm)
|
₹ 77,052
|
₹ 76,582
|
₹ 76,463
|
-0.2%
|
13.3%
|
|
GP Sheet (0.63 mm)
|
₹ 86,505
|
₹ 86,415
|
₹ 86,668
|
0.3%
|
17.7%
|
Note: Prices are inclusive of GST and shown in ₹/tonne, based on average prices from four metro cities—Kolkata, Delhi, Mumbai, and Chennai.
1d. Alloy Steel — Production, Import, Export & Consumption (in ‘000t)
|
Indicator
|
Jul 2026
|
Jul 2025
|
YoY %
|
Apr-Jul 2026
|
Apr-Jul 2025
|
CPLY %
|
|
Production
|
982.6
|
801.0
|
22.7
|
3710.8
|
2927.9
|
26.7
|
|
Import
|
79.8
|
97.0
|
-17.8
|
419.3
|
383.1
|
9.4
|
|
Export
|
44.1
|
10.8
|
307.4
|
122.2
|
48.7
|
150.7
|
|
Consumption
|
1004.0
|
902.2
|
11.3
|
4022.9
|
3294.0
|
22.1
|
1e. Stainless Steel — Production, Import, Export & Consumption (in ‘000t)
|
Indicator
|
Jul 2026
|
Jul 2025
|
YoY %
|
Apr-Jul 2026
|
Apr-Jul 2025
|
CPLY %
|
|
Production
|
352.6
|
389.0
|
-9.4
|
1375.6
|
1436.6
|
-4.2
|
|
Import
|
186.6
|
68.8
|
171.3
|
497.0
|
235.1
|
111.4
|
|
Export
|
45.2
|
48.8
|
-7.4
|
166.7
|
240.6
|
-30.7
|
|
Consumption
|
589.1
|
411.5
|
43.2
|
1770.0
|
1416.4
|
25.0
|
2. Demand (in Mt)
|
Indicator
|
Jul 2026
|
Jul 2025
|
YoY %
|
Apr-Jul 2026
|
Apr-Jul 2025
|
CPLY %
|
|
Finished Steel Consumption
|
14.4
|
13.5
|
6.8
|
56.0
|
51.9
|
7.9
|
3. Trade Dynamics
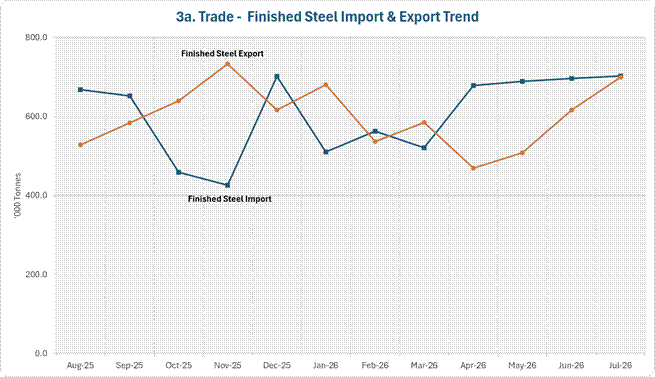
3a. Finished Steel — Import & Export
|
Indicator
|
Unit
|
Jul-26
|
Jul-25
|
YoY %
|
Apr-Jul 2026
|
Apr-Jul 2025
|
CPLY %
|
|
Imports
|
‘000 t
|
702.3
|
641.2
|
9.5
|
2766.2
|
2024.9
|
36.6
|
|
Rs Crore
|
8116.3
|
5776.2
|
40.5
|
28330.8
|
19795.0
|
43.1
|
|
Exports
|
‘000 t
|
699.3
|
485.4
|
44.1
|
2292.3
|
1698.0
|
35.0
|
|
Rs Crore
|
5630.2
|
4220.2
|
33.4
|
18105.4
|
13996.1
|
29.4
|
|
Net Trade Position
|
India was net importer of finished steel in terms of quantity for the period of Apr-Jul 2026
|
3b. Top 5 Countries — Finished Steel Import & Export (Apr-Jul 2026)
|
Rank
|
Import Country
|
Vol. ('000t)
|
Share %
|
|
Rank
|
Export Country
|
Vol. ('000t)
|
Share %
|
|
1
|
CHINA
|
855.8
|
30.9
|
|
1
|
VIETNAM
|
354.0
|
15.4
|
|
2
|
KOREA
|
835.4
|
30.2
|
|
2
|
UAE
|
339.6
|
14.8
|
|
3
|
JAPAN
|
413.3
|
14.9
|
|
3
|
BELGIUM
|
183.0
|
8.0
|
|
4
|
INDONESIA
|
172.3
|
6.2
|
|
4
|
ITALY
|
161.5
|
7.0
|
|
5
|
VIETNAM
|
139.8
|
5.1
|
|
5
|
NEPAL
|
150.4
|
6.6
|
3c. Top Categories — Finished Steel Import & Export (Apr-Jul 2026)
|
Rank
|
Import Category
|
Vol. ('000t)
|
Share %
|
|
Rank
|
Export Category
|
Vol. ('000t)
|
Share %
|
|
1
|
HR
COIL/STRIP
|
1015.2
|
36.7
|
|
1
|
HR
COIL/STRIP
|
841.5
|
36.7
|
|
2
|
CR
COIL/SHEETS
|
488.6
|
17.7
|
|
2
|
PIPES
|
356.7
|
15.6
|
|
3
|
GP/GC
SHEETS/COIL
|
437.8
|
15.8
|
|
3
|
GP/GC
SHEETS/COIL
|
297.2
|
13.0
|
|
4
|
PLATES
|
244.6
|
8.8
|
|
4
|
BARS &
RODS
|
292.4
|
12.8
|
|
5
|
BARS &
RODS
|
197.3
|
7.1
|
|
5
|
PLATES
|
245.5
|
10.7
|
4. Raw Materials
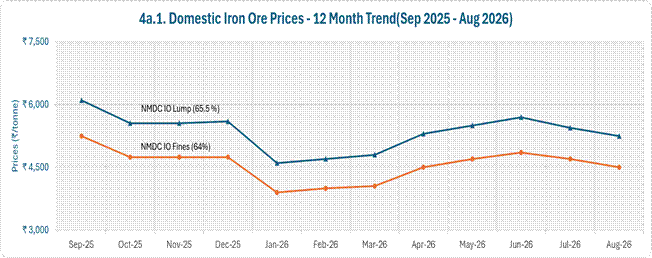
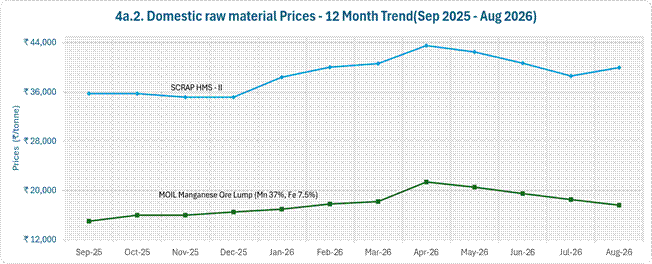
4a. Domestic Raw Material Prices (₹/tonne)
|
Commodity
|
Jul 2026
|
Aug 2026
|
MoM Change
|
|
NMDC Iron Ore Baila Lump (65.5%, 10-40 mm)
|
₹ 5,450
|
₹ 5,250
|
-3.7
|
|
NMDC Iron Ore Baila Fines (64%, 0-10 mm)
|
₹ 4,700
|
₹ 4,500
|
-4.3
|
|
MOIL Manganese Ore Lump (Mn 37%, Fe 7.5%)
|
₹ 18,530
|
₹ 17,603
|
-5.0
|
|
Scrap — HMS II
|
₹ 38,580
|
₹ 39,970
|
3.6
|
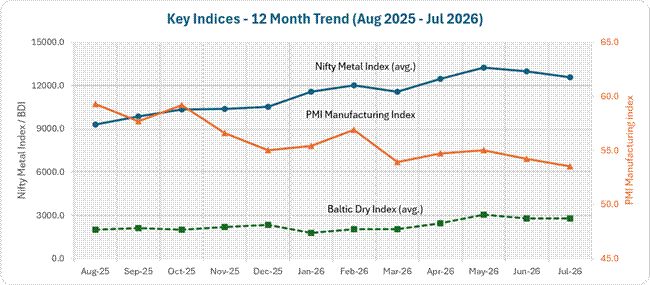
5. Key Indices
|
Index
|
May 2026
|
Jun 2026
|
Jul 2026
|
MoM Change
|
YoY Change
|
|
Nifty Metal Index (avg.)
|
13,224.9
|
12,971.9
|
12,556.4
|
-3.2%
|
32.6%
|
|
PMI Manufacturing Index
|
55.0
|
54.2
|
53.5
|
-1.3%
|
-9.5%
|
|
Baltic Dry Index (avg.)
|
3,048.9
|
2,779.9
|
2,769.9
|
-0.4%
|
52.2%
|
Source: NSE, S&P Global, Trading Economics
6. Policy Initiatives/Industry Initiatives
The Ministry of Steel launched a monthly webinar series on digitalization in the steel and mining sector, bringing together industry leaders, CPSEs, startups and technology providers to showcase digital solutions, share implementation experiences and discuss emerging opportunities. The first webinar was held on 21 August 2026, marking the beginning of an initiative aimed at accelerating the adoption of digital technologies across the sector. The series is expected to foster collaboration and knowledge sharing, supporting the development of a smarter, more efficient and technology-driven steel and mining industry.
The Mines and Minerals (Development and Regulation) Amendment Act, 2026 has been notified on 17 August 2026. The amendment is expected to strengthen raw material security for the steel sector by improving the investment climate for mining, supporting mine development and enhancing the domestic availability of key minerals, including iron ore.
A new milestone has been achieved at NMDC Bacheli, with the 2.0 MTPA Iron Ore Beneficiation Plant commencing trial operations. The plant has successfully completed its first hot trial using iron ore fines for slurry production, marking a key step towards strengthening NMDC’s integrated beneficiation capabilities.
MECON and NMDC Steel Limited (NSL) have signed a Memorandum of Agreement (MoA) for providing consultancy services for NSL’s upcoming projects. The partnership is expected to support efficient project planning and execution, while facilitating capacity expansion and technological advancement.
7. Green Steel Initiatives
Under the Ministry of Steel’s Green Steel Initiative, 98 steel producers across 15 states have received Green Steel Certificates. The certification covers products including TMT bars, HR/CR coils, plates, wire rods and pipes, with most certified products achieving the highest 5-star rating, highlighting the increasing adoption of low-emission steelmaking practices among India’s secondary and mid-sized steel producers.
Source: Provisional JPC data for July 2026. Mt = Million Tonnes; Mtpa = Million Tonnes Per Annum; MoM = Month-on-Month; YoY = Year-on-Year; CPLY = Corresponding Period Last Year
****
AG
(Release ID: 2303018)
Visitor Counter : 2293