Ministry of Commerce & Industry
India’s total exports estimated to grow at 10.25 % in May 2024; cumulative overall exports during April-May 2024 estimated to grow at 9.21%
Merchandise exports register positive growth of 9.10% at USD 38.13 Billion in May 2024 as compared to USD 34.95 Billion in May 2023
Cumulative value of exports during April-May 2024 stands at USD 73.12 Billion as compared to USD 69.57 Billion during April-May 2023, registering a positive growth of 5.10%
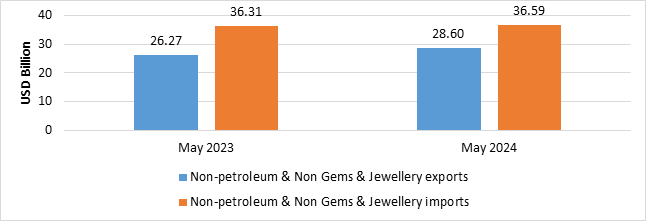
Non-petroleum & Non-Gems & Jewellery exports register an increase of 8.83% from USD 26.27 Billion in May 2023 to USD 28.60 Billion in May 2024
Major drivers of merchandise exports growth in May 2024 include Petroleum Products, Engineering Goods, Electronic Goods, Drugs & Pharmaceuticals, RMG of all Textiles and Plastic & Linoleum
Petroleum products exports increase by 15.75% from USD 5.85 Billion in May 2023 to USD 6.78 Billion in May 2024
Engineering Goods exports increase by 7.39% from USD 9.3 Billion in May 2023 to USD 9.99 Billion in May 2024
Electronic goods exports increase by 22.97% from USD 2.41 Billion in May 2023 to USD 2.97 Billion in May 2024
Drugs and pharmaceuticals exports increase by 10.45% from USD 2.08 Billion in May 2023 to USD 2.30 Billion in May 2024
RMG of all Textiles exports increase by 9.84% from USD 1.24 Billion in May 2023 to USD 1.36 Billion in May 2024
Plastic & Linoleum exports increase by 16.6% from USD 0.65 Billion in May 2023 to USD 0.76 Billion in May 2024
प्रविष्टि तिथि:
14 JUN 2024 4:21PM by PIB Delhi
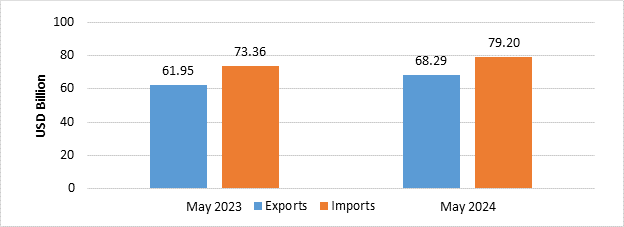
India’s total exports (Merchandise and Services combined) for May 2024* is estimated at USD 68.29 Billion, registering a positive growth of 10.25 percent vis-à-vis May 2023.Total imports (Merchandise and Services combined) for May 2024* is estimated at USD 79.20 Billion, registering a positive growth of 7.95 percent vis-à-vis May 2023.
Table 1: Trade during May 2024*
|
|
|
May 2024
(USD Billion)
|
May 2023
(USD Billion)
|
|
Merchandise
|
Exports
|
38.13
|
34.95
|
|
Imports
|
61.91
|
57.48
|
|
Services*
|
Exports
|
30.16
|
26.99
|
|
Imports
|
17.28
|
15.88
|
|
Total Trade
(Merchandise +Services) *
|
Exports
|
68.29
|
61.95
|
|
Imports
|
79.20
|
73.36
|
|
Trade Balance
|
-10.90
|
-11.41
|
* Note: The latest data for services sector released by RBI is for April2024. The data for May 2024 is an estimation, which will be revised based on RBI’s subsequent release.
Fig 1: Total Trade during May 2024*
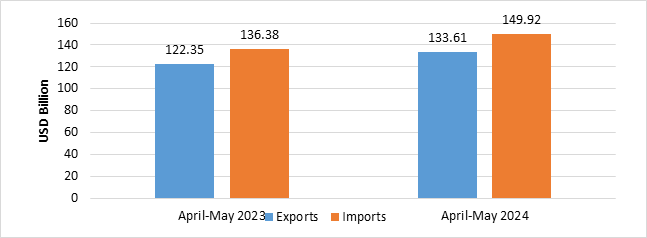
India’s total exports during April-May2024* is estimated at USD 133.61 Billion registering a positive growth of 9.21 percent. Total imports during April-May 2024* is estimated at USD 149.92 Billion registering a growth of 9.93 percent.
Table 2: Trade during April-May 2024*
|
|
|
April-May 2024
(USD Billion)
|
April-May 2023
(USD Billion)
|
|
Merchandise
|
Exports
|
73.12
|
69.57
|
|
Imports
|
116.01
|
106.54
|
|
Services*
|
Exports
|
60.49
|
52.77
|
|
Imports
|
33.91
|
29.84
|
|
Total Trade
(Merchandise +Services) *
|
Exports
|
133.61
|
122.35
|
|
Imports
|
149.92
|
136.38
|
|
Trade Balance
|
-16.31
|
-14.03
|
Fig 2: Total Trade during April-May 2024*
MERCHANDISE TRADE
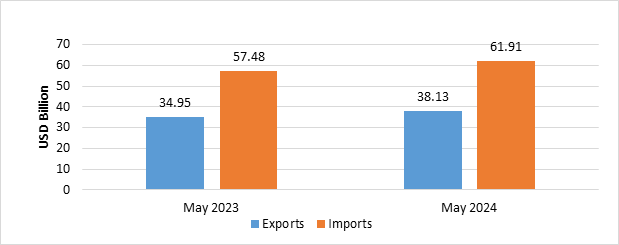
- Merchandise exports during May 2024 were USD 38.13 Billion as compared to USD 34.95 Billion in May 2023.
- Merchandise imports during May 2024 were USD 61.91 Billion as compared to USD 57.48 Billion in May 2023.
Fig 3: Merchandise Trade during May 2024
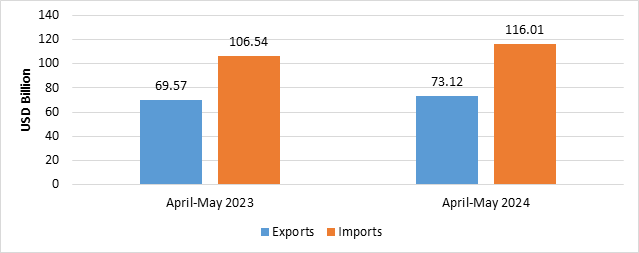
- Merchandise exports during April-May 2024 were USD 73.12 Billion as compared to USD 69.57Billion during April-May 2023.
- Merchandise imports during April-May 2024 were USD 116.01 Billion compared to USD 106.54 Billion during April-May 2023.
- Merchandise trade deficit during April-May 2024 was USD 42.89 Billion compared to USD 36.97 Billion during April-May 2023.
Fig4: Merchandise Trade during April-May 2024
- Non-petroleum and non-gems & jewellery exports in May 2024 were USD 28.60Billion compared to USD 26.27Billion in May 2023.
- Non-petroleum, non-gems & jewellery (gold, silver & precious metals) imports in May 2024 were USD 36.59Billion compared to USD 36.31Billion in May 2023.
Table 3: Trade excluding Petroleum and Gems &Jewellery during May 2024
|
|
May 2024
(USD Billion)
|
May 2023
(USD Billion)
|
|
Non- petroleum exports
|
31.36
|
29.10
|
|
Non- petroleum imports
|
41.97
|
41.91
|
|
Non-petroleum &Non-Gems & Jewellery exports
|
28.60
|
26.27
|
|
Non-petroleum &Non-Gems & Jewellery imports
|
36.59
|
36.31
|
Note: Gems &Jewellery Imports include Gold, Silver & Pearls, precious & Semi-precious stones
Fig 5: Trade excluding Petroleum and Gems &Jewellery during May 2024
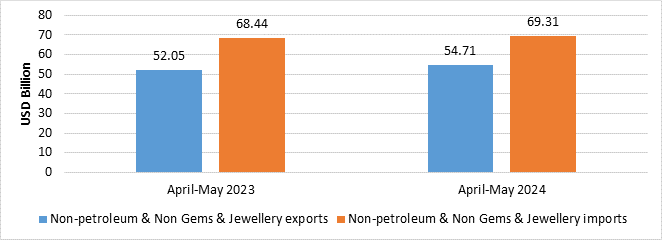
- Non-petroleum and non-gems & jewellery exports in April-May 2024 were USD 54.71 Billion, compared to USD 52.05 Billion in April-May 2023.
- Non-petroleum, non-gems & jewellery (gold, silver & precious metals) imports in April-May 2024 were USD 69.31 Billion, compared to USD 68.44 Billion in April-May 2023.
Table 4: Trade excluding Petroleum and Gems &Jewellery during April-May 2024
|
|
April-May 2024
(USD Billion)
|
April-May 2023
(USD Billion)
|
|
Non- petroleum exports
|
59.73
|
57.30
|
|
Non- petroleum imports
|
79.60
|
77.27
|
|
Non-petroleum &Non Gems & Jewellery exports
|
54.71
|
52.05
|
|
Non-petroleum &Non Gems & Jewellery imports
|
69.31
|
68.44
|
Note: Gems & Jewellery Imports include Gold, Silver & Pearls, precious & Semi-precious stones
Fig 6: Trade excluding Petroleum and Gems & Jewellery during April-May 2024
SERVICES TRADE
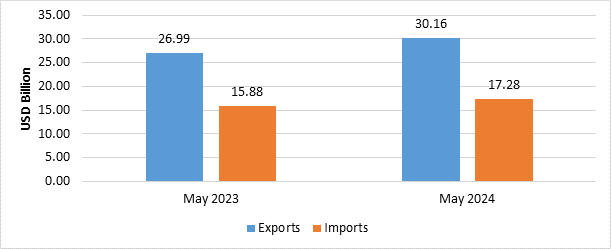
- The estimated value of services export for May 2024* is USD 30.16 Billion as compared to USD 26.99Billion in May 2023.
- The estimated value of services imports for May 2024* is USD 17.28 Billion as compared to USD 15.88Billion in May 2023.
Fig 7: Services Trade during May 2024*
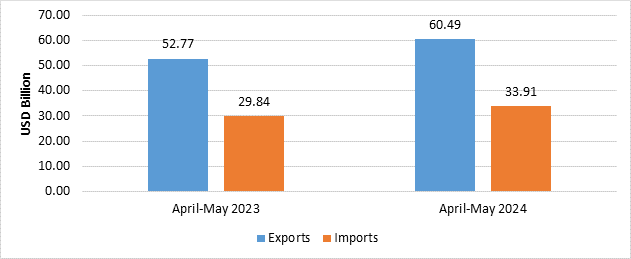
- The estimated value of service exports during April-May 2024* is USD 60.49 Billion as compared to USD 52.77 Billion in April-May 2023.
- The estimated value of service imports during April-May 2024* is USD 33.91 Billion as compared to USD 29.84 Billion in April-May 2023.
- The services trade surplus for April-May 2024* is USD 26.58 Billion as compared to USD 22.94 Billion in April-May 2023.
Fig 8: Services Trade during April-May 2024*
Exports of Coffee (64.23%), Tobacco (58.38%), Electronic Goods (22.97%), Meat, dairy & poultry products (22.95%), Fruits & Vegetables (20.75%), Handicrafts excl. handmade carpet (20.63%), Tea (19.57%), Carpet (17.55%), Plastic & Linoleum (16.6%), Petroleum Products (15.75%), Cereal preparations & miscellaneous processed items (14.31%), Drugs & Pharmaceuticals (10.45%), RMG of all Textiles (9.84%), Cotton Yarn/Fabs./made-ups, Handloom Products etc. (9.75%), Engineering Goods (7.39%), Oil seeds (5.75%), Man-made Yarn/Fabs./made-ups etc. (4.65%), Organic & Inorganic Chemicals (3.21%), Rice (2.76%) and Mica, Coal & Other Ores, Minerals including processed minerals (1.08%) record positive growth during May 2024 over the corresponding month of last year.
Imports of Project goods (-44.31%), Coal, Coke & Briquettes, etc.(-26.55%),Cotton Raw & Waste(-24.46%),Sulphur & Unroasted Iron Pyrts(-20.92%), Fertilisers, Crude & manufactured(-20.42%), Leather & leather products(-20.05%), Chemical material & products (-9.81%), Gold (-9.76%), Wood & Wood products(-7.2%),Iron & Steel (-6.65%),Dyeing/tanning/colouring mtrls.(-5.1%),Newsprint(-4.49%), Textile yarn Fabric, made-up articles(-1.15%) and Organic & Inorganic Chemicals(-0.49%) record negative growth during May 2024 over the corresponding month of last year.
Services exports is estimated to grow by 14.63percent during April-May 2024* over April-May 2023.
Top 5 export destinations, in terms of change in value, exhibiting positive growth in May 2024 vis a vis May 2023 are U S A (13.06%), Netherland (43.92%), U Arab Emts (19.43%), Malaysia (86.95%) and U K (33.54%).
Top 5 export destinations, in terms of change in value, exhibiting positive growth in April-May 2024 vis a vis April-May 2023 are U S A (12.66%), Netherland (40.87%), U Arab Emts (16.16%), Singapore (36.65%) and Malaysia (64.03%).
Top 5 import sources, in terms of change in value, exhibiting growth in May 2024 vis a vis May 2023 are U Arab Emts (49.93%), Iraq (58.68%), Russia (18.02%), Angola (1274.95%) and Indonesia (23.36%).
Top 5 import sources, in terms of change in value, exhibiting growth in April-May 2024 vis a vis April-May2023 are Russia (19.89%), U Arab Emts (28.83%), Iraq (34.12%), Switzerland (26.43%) and Angola (256.01%).
QUICK ESTIMATES FOR SELECTED MAJOR COMMODITIES FOR MAY 2024
TRADE: EXPORT
|
Sl. No.
|
Commodities
|
Values in Million USD
|
% Change
|
|
MAY'23
|
APR'23-MAY'23
|
MAY'24
|
APR'24-MAY'24
|
MAY'24
|
APR'24-MAY'24
|
|
1
|
Tea
|
54.07
|
101.82
|
64.66
|
124.70
|
19.57
|
22.47
|
|
2
|
Coffee
|
112.97
|
231.44
|
185.54
|
322.80
|
64.23
|
39.48
|
|
3
|
Rice
|
977.28
|
1977.53
|
1004.29
|
1956.36
|
2.76
|
-1.07
|
|
4
|
Other cereals
|
104.45
|
167.98
|
19.37
|
41.58
|
-81.45
|
-75.25
|
|
5
|
Tobacco
|
91.27
|
196.12
|
144.56
|
263.26
|
58.38
|
34.24
|
|
6
|
Spices
|
453.07
|
814.37
|
361.17
|
766.79
|
-20.28
|
-5.84
|
|
7
|
Cashew
|
28.17
|
55.25
|
20.91
|
43.23
|
-25.79
|
-21.75
|
|
8
|
Oil Meals
|
150.98
|
349.47
|
113.00
|
246.22
|
-25.16
|
-29.54
|
|
9
|
Oil seeds
|
103.85
|
239.99
|
109.82
|
222.54
|
5.75
|
-7.27
|
|
10
|
Fruits & Vegetables
|
245.10
|
558.37
|
295.97
|
589.12
|
20.75
|
5.51
|
|
11
|
Cereal preparations & miscellaneous processed items
|
230.77
|
464.74
|
263.79
|
509.45
|
14.31
|
9.62
|
|
12
|
Marine Products
|
599.27
|
1166.89
|
575.84
|
1070.03
|
-3.91
|
-8.30
|
|
13
|
Meat, dairy & poultry products
|
307.75
|
647.93
|
378.37
|
699.81
|
22.95
|
8.01
|
|
14
|
Iron Ore
|
288.90
|
643.75
|
268.76
|
414.63
|
-6.97
|
-35.59
|
|
15
|
Mica, Coal & Other Ores, Minerals including processed minerals
|
382.48
|
773.46
|
386.60
|
727.79
|
1.08
|
-5.90
|
|
16
|
Leather & leather products
|
369.18
|
695.97
|
361.31
|
664.62
|
-2.13
|
-4.51
|
|
17
|
Ceramic products & glassware
|
373.07
|
736.78
|
360.19
|
700.17
|
-3.45
|
-4.97
|
|
18
|
Gems &Jewellery
|
2823.14
|
5248.45
|
2759.94
|
5017.83
|
-2.24
|
-4.39
|
|
19
|
Drugs & Pharmaceuticals
|
2084.06
|
4346.03
|
2301.88
|
4730.66
|
10.45
|
8.85
|
|
20
|
Organic & Inorganic Chemicals
|
2237.01
|
4375.35
|
2308.75
|
4805.17
|
3.21
|
9.82
|
|
21
|
Engineering Goods
|
9300.75
|
18250.12
|
9988.43
|
18653.96
|
7.39
|
2.21
|
|
22
|
Electronic Goods
|
2414.22
|
4521.83
|
2968.66
|
5619.97
|
22.97
|
24.29
|
|
23
|
Cotton Yarn/Fabs./made-ups, Handloom Products etc.
|
919.88
|
1807.70
|
1009.61
|
1956.46
|
9.75
|
8.23
|
|
24
|
Man-made Yarn/Fabs./made-ups etc.
|
395.43
|
788.36
|
413.82
|
782.17
|
4.65
|
-0.79
|
|
25
|
RMG of all Textiles
|
1235.81
|
2446.66
|
1357.40
|
2555.79
|
9.84
|
4.46
|
|
26
|
Jute Mfg. including Floor Covering
|
30.38
|
63.79
|
28.79
|
55.91
|
-5.21
|
-12.36
|
|
27
|
Carpet
|
111.23
|
216.40
|
130.75
|
241.84
|
17.55
|
11.76
|
|
28
|
Handicrafts excl. handmade carpet
|
123.37
|
245.46
|
148.82
|
273.82
|
20.63
|
11.55
|
|
29
|
Petroleum Products
|
5854.37
|
12274.93
|
6776.29
|
13390.59
|
15.75
|
9.09
|
|
30
|
Plastic & Linoleum
|
650.79
|
1297.65
|
758.81
|
1424.76
|
16.60
|
9.79
|
| |
Sub-Total
|
33053.08
|
65704.59
|
35866.10
|
68872.03
|
8.51
|
4.82
|
|
|
GRAND TOTAL
|
34952.48
|
69570.93
|
38132.48
|
73116.68
|
9.10
|
5.10
|
Note 1: Exports include Re-Exports.
Note 2: The figures for MAY’24 are provisional.
Note 3: Grand total is inclusive of component ‘Other
QUICK ESTIMATES FOR SELECTED MAJOR COMMODITIES FOR MAY 2024
TRADE: EXPORT
|
Sl. No.
|
Commodities
|
Values in Rs Crore
|
% Change
|
|
MAY'23
|
APR'23-MAY'23
|
MAY'24
|
APR'24-MAY'24
|
MAY'24
|
APR'24-MAY'24
|
|
1
|
Tea
|
445.25
|
836.89
|
539.19
|
1040.01
|
21.10
|
24.27
|
|
2
|
Coffee
|
930.24
|
1901.90
|
1547.24
|
2692.12
|
66.33
|
41.55
|
|
3
|
Rice
|
8047.28
|
16251.37
|
8375.09
|
16315.86
|
4.07
|
0.40
|
|
4
|
Other cereals
|
860.11
|
1381.16
|
161.57
|
346.74
|
-81.21
|
-74.89
|
|
5
|
Tobacco
|
751.53
|
1611.53
|
1205.49
|
2195.58
|
60.40
|
36.24
|
|
6
|
Spices
|
3730.72
|
6694.10
|
3011.91
|
6395.04
|
-19.27
|
-4.47
|
|
7
|
Cashew
|
232.00
|
454.08
|
174.37
|
360.57
|
-24.84
|
-20.59
|
|
8
|
Oil Meals
|
1243.20
|
2871.27
|
942.30
|
2053.48
|
-24.20
|
-28.48
|
|
9
|
Oil seeds
|
855.11
|
1971.80
|
915.79
|
1855.98
|
7.10
|
-5.87
|
|
10
|
Fruits & Vegetables
|
2018.26
|
4587.71
|
2468.14
|
4913.20
|
22.29
|
7.09
|
|
11
|
Cereal preparations & miscellaneous processed items
|
1900.26
|
3819.29
|
2199.82
|
4248.76
|
15.76
|
11.24
|
|
12
|
Marine Products
|
4934.62
|
9590.24
|
4802.14
|
8923.96
|
-2.68
|
-6.95
|
|
13
|
Meat, dairy & poultry products
|
2534.13
|
5324.32
|
3155.34
|
5836.33
|
24.51
|
9.62
|
|
14
|
Iron Ore
|
2378.90
|
5289.43
|
2241.24
|
3457.93
|
-5.79
|
-34.63
|
|
15
|
Mica, Coal & Other Ores, Minerals including processed minerals
|
3149.48
|
6356.28
|
3224.00
|
6069.73
|
2.37
|
-4.51
|
|
16
|
Leather & leather products
|
3039.94
|
5720.31
|
3013.07
|
5542.82
|
-0.88
|
-3.10
|
|
17
|
Ceramic products & glassware
|
3071.95
|
6055.14
|
3003.69
|
5839.36
|
-2.22
|
-3.56
|
|
18
|
Gems &Jewellery
|
23246.67
|
43139.29
|
23015.97
|
41848.08
|
-0.99
|
-2.99
|
|
19
|
Drugs & Pharmaceuticals
|
17160.82
|
35713.69
|
19196.08
|
39453.54
|
11.86
|
10.47
|
|
20
|
Organic & Inorganic Chemicals
|
18420.26
|
35959.11
|
19253.38
|
40074.95
|
4.52
|
11.45
|
|
21
|
Engineering Goods
|
76585.46
|
149988.87
|
83296.39
|
155572.11
|
8.76
|
3.72
|
|
22
|
Electronic Goods
|
19879.48
|
37166.23
|
24756.49
|
46870.06
|
24.53
|
26.11
|
|
23
|
Cotton Yarn/Fabs./made-ups, Handloom Products etc.
|
7574.63
|
14856.58
|
8419.45
|
16316.75
|
11.15
|
9.83
|
|
24
|
Man-made Yarn/Fabs./made-ups etc.
|
3256.08
|
6478.96
|
3450.98
|
6523.21
|
5.99
|
0.68
|
|
25
|
RMG of all Textiles
|
10176.08
|
20107.55
|
11319.73
|
21315.07
|
11.24
|
6.01
|
|
26
|
Jute Mfg. including Floor Covering
|
250.12
|
524.21
|
240.12
|
466.25
|
-4.00
|
-11.06
|
|
27
|
Carpet
|
915.91
|
1778.54
|
1090.33
|
2016.96
|
19.04
|
13.41
|
|
28
|
Handicrafts excl. handmade carpet
|
1015.87
|
2017.24
|
1241.04
|
2283.61
|
22.17
|
13.20
|
|
29
|
Petroleum Products
|
48206.79
|
100868.75
|
56509.45
|
111676.65
|
17.22
|
10.71
|
|
30
|
Plastic & Linoleum
|
5358.82
|
10664.45
|
6327.96
|
11882.33
|
18.08
|
11.42
|
| |
Sub-Total
|
272170.00
|
539980.30
|
299097.77
|
574387.07
|
9.89
|
6.37
|
|
|
GRAND TOTAL
|
287810.22
|
571753.51
|
317997.81
|
609787.03
|
10.49
|
6.65
|
Note 1: Grand total is inclusive of component ‘Other’.
Note 2: The figures for MAY’24 are provisional.
QUICK ESTIMATES FOR SELECTED MAJOR COMMODITIES FOR MAY 2024
TRADE: IMPORT
|
Sl. No.
|
Commodities
|
Values in Million USD
|
% Change
|
|
MAY'23
|
APR'23-MAY'23
|
MAY'24
|
APR'24-MAY'24
|
MAY'24
|
APR'24-MAY'24
|
|
1
|
Cotton Raw & Waste
|
58.09
|
103.39
|
43.88
|
81.79
|
-24.46
|
-20.89
|
|
2
|
Vegetable Oil
|
1140.09
|
2218.38
|
1453.12
|
2790.55
|
27.46
|
25.79
|
|
3
|
Pulses
|
131.84
|
282.79
|
370.91
|
781.99
|
181.34
|
176.53
|
|
4
|
Fruits & vegetables
|
218.28
|
417.87
|
224.80
|
479.60
|
2.99
|
14.77
|
|
5
|
Pulp and Waste paper
|
136.50
|
283.04
|
167.90
|
311.22
|
23.01
|
9.96
|
|
6
|
Textile yarn Fabric, made-up articles
|
188.24
|
349.50
|
186.08
|
347.92
|
-1.15
|
-0.45
|
|
7
|
Fertilisers, Crude & manufactured
|
1180.48
|
1831.76
|
939.37
|
1536.57
|
-20.42
|
-16.12
|
|
8
|
Sulphur & Unroasted Iron Pyrites
|
6.59
|
28.89
|
5.21
|
11.51
|
-20.92
|
-60.14
|
|
9
|
Metaliferrous ores & other minerals
|
925.04
|
1483.98
|
966.33
|
1557.61
|
4.46
|
4.96
|
|
10
|
Coal, Coke & Briquettes, etc.
|
4492.28
|
7998.80
|
3299.74
|
6395.68
|
-26.55
|
-20.04
|
|
11
|
Petroleum, Crude & products
|
15574.12
|
29267.92
|
19948.63
|
36411.05
|
28.09
|
24.41
|
|
12
|
Wood & Wood products
|
581.68
|
1119.50
|
539.77
|
1001.69
|
-7.20
|
-10.52
|
|
13
|
Leather & leather products
|
95.04
|
156.66
|
75.98
|
138.07
|
-20.05
|
-11.87
|
|
14
|
Organic & Inorganic Chemicals
|
2561.36
|
4894.29
|
2548.81
|
4754.82
|
-0.49
|
-2.85
|
|
15
|
Dyeing/tanning/colouring materials
|
354.07
|
688.19
|
336.03
|
661.35
|
-5.10
|
-3.90
|
|
16
|
Artificial resins, plastic materials, etc.
|
1883.78
|
3782.11
|
1888.33
|
3591.90
|
0.24
|
-5.03
|
|
17
|
Chemical material & products
|
1057.05
|
2044.72
|
953.30
|
1865.00
|
-9.81
|
-8.79
|
|
18
|
Newsprint
|
39.72
|
63.85
|
37.94
|
65.09
|
-4.49
|
1.94
|
|
19
|
Pearls, precious & Semi-precious stones
|
1878.65
|
3986.89
|
1909.50
|
3572.58
|
1.64
|
-10.39
|
|
20
|
Iron & Steel
|
1824.30
|
3530.95
|
1703.00
|
3269.02
|
-6.65
|
-7.42
|
|
21
|
Non-ferrous metals
|
2047.76
|
3816.11
|
2070.52
|
3848.63
|
1.11
|
0.85
|
|
22
|
Machine tools
|
397.19
|
726.64
|
445.82
|
846.00
|
12.24
|
16.43
|
|
23
|
Machinery, electrical & non-electrical
|
4138.33
|
8069.01
|
4148.68
|
7940.30
|
0.25
|
-1.60
|
|
24
|
Transport equipment
|
2341.05
|
4486.76
|
3087.28
|
5227.74
|
31.88
|
16.51
|
|
25
|
Project goods
|
56.78
|
88.97
|
31.62
|
69.35
|
-44.31
|
-22.05
|
|
26
|
Professional instrument, Optical goods, etc.
|
628.86
|
1205.43
|
643.79
|
1269.67
|
2.37
|
5.33
|
|
27
|
Electronic goods
|
6702.87
|
13111.28
|
7149.18
|
14200.43
|
6.66
|
8.31
|
|
28
|
Medicinal & Pharmaceutical products
|
702.49
|
1279.88
|
763.43
|
1447.01
|
8.67
|
13.06
|
|
29
|
Gold
|
3693.47
|
4701.47
|
3333.03
|
6447.66
|
-9.76
|
37.14
|
|
30
|
Silver
|
27.15
|
140.04
|
137.93
|
272.07
|
407.99
|
94.28
|
| |
Sub-Total
|
55063.15
|
102159.08
|
59409.91
|
111193.87
|
7.89
|
8.84
|
|
|
GRAND TOTAL
|
57481.42
|
106537.53
|
61914.33
|
116009.84
|
7.71
|
8.89
|
Note 1: Imports include Re-Imports.
Note 2: The figures for MAY’24 are provisional.
Note 3: Grand total is inclusive of component ‘Other’.
QUICK ESTIMATES FOR SELECTED MAJOR COMMODITIES FOR MAY 2024
TRADE: IMPORT
|
Sl. No.
|
Commodities
|
Values in Rs Crore
|
% Change
|
|
MAY'23
|
APR'23-MAY'23
|
MAY'24
|
APR'24-MAY'24
|
MAY'24
|
APR'24-MAY'24
|
|
1
|
Cotton Raw & Waste
|
478.35
|
849.89
|
365.90
|
682.10
|
-23.51
|
-19.74
|
|
2
|
Vegetable Oil
|
9387.85
|
18232.11
|
12118.03
|
23273.01
|
29.08
|
27.65
|
|
3
|
Pulses
|
1085.59
|
2323.72
|
3093.09
|
6521.73
|
184.92
|
180.66
|
|
4
|
Fruits & vegetables
|
1797.41
|
3434.43
|
1874.66
|
3999.84
|
4.30
|
16.46
|
|
5
|
Pulp and Waste paper
|
1123.97
|
2325.90
|
1400.13
|
2595.54
|
24.57
|
11.59
|
|
6
|
Textile yarn Fabric, made-up articles
|
1550.03
|
2872.74
|
1551.75
|
2901.58
|
0.11
|
1.00
|
|
7
|
Fertilisers, Crude & manufactured
|
9720.49
|
15062.35
|
7833.71
|
12814.69
|
-19.41
|
-14.92
|
|
8
|
Sulphur & Unroasted Iron Pyrites
|
54.25
|
237.16
|
43.44
|
96.02
|
-19.93
|
-59.51
|
|
9
|
Metaliferrous ores & other minerals
|
7617.10
|
12201.53
|
8058.49
|
12990.14
|
5.79
|
6.46
|
|
10
|
Coal, Coke & Briquettes, etc.
|
36990.90
|
65751.67
|
27517.52
|
53339.54
|
-25.61
|
-18.88
|
|
11
|
Petroleum, Crude & products
|
128242.46
|
240560.06
|
166357.38
|
303663.80
|
29.72
|
26.23
|
|
12
|
Wood & Wood products
|
4789.71
|
9200.97
|
4501.34
|
8354.01
|
-6.02
|
-9.21
|
|
13
|
Leather & leather products
|
782.59
|
1288.02
|
633.63
|
1151.50
|
-19.03
|
-10.60
|
|
14
|
Organic & Inorganic Chemicals
|
21091.10
|
40225.98
|
21255.23
|
39654.66
|
0.78
|
-1.42
|
|
15
|
Dyeing/tanning/colouring materials
|
2915.53
|
5656.03
|
2802.26
|
5515.65
|
-3.89
|
-2.48
|
|
16
|
Artificial resins, plastic materials, etc.
|
15511.64
|
31081.93
|
15747.30
|
29956.09
|
1.52
|
-3.62
|
|
17
|
Chemical material & products
|
8704.07
|
16805.03
|
7949.83
|
15553.92
|
-8.67
|
-7.44
|
|
18
|
Newsprint
|
327.11
|
525.02
|
316.41
|
542.88
|
-3.27
|
3.40
|
|
19
|
Pearls, precious & Semi-precious stones
|
15469.46
|
32761.41
|
15923.88
|
29795.00
|
2.94
|
-9.05
|
|
20
|
Iron & Steel
|
15021.87
|
29019.93
|
14201.85
|
27263.41
|
-5.46
|
-6.05
|
|
21
|
Non-ferrous metals
|
16861.94
|
31366.05
|
17266.69
|
32097.20
|
2.40
|
2.33
|
|
22
|
Machine tools
|
3270.61
|
5972.79
|
3717.80
|
7055.56
|
13.67
|
18.13
|
|
23
|
Machinery, electrical & non-electrical
|
34076.37
|
66316.12
|
34597.05
|
66221.42
|
1.53
|
-0.14
|
|
24
|
Transport equipment
|
19276.98
|
36876.28
|
25745.71
|
43598.39
|
33.56
|
18.23
|
|
25
|
Project goods
|
467.56
|
731.57
|
263.65
|
578.35
|
-43.61
|
-20.94
|
|
26
|
Professional instrument, Optical goods, etc.
|
5178.21
|
9907.35
|
5368.77
|
10589.02
|
3.68
|
6.88
|
|
27
|
Electronic goods
|
55193.68
|
107755.96
|
59619.12
|
118430.73
|
8.02
|
9.91
|
|
28
|
Medicinal & Pharmaceutical products
|
5784.53
|
10520.35
|
6366.50
|
12067.99
|
10.06
|
14.71
|
|
29
|
Gold
|
30413.23
|
38680.91
|
27795.08
|
53772.97
|
-8.61
|
39.02
|
|
30
|
Silver
|
223.58
|
1149.48
|
1150.21
|
2268.98
|
414.45
|
97.39
|
|
|
Sub-Total
|
453408.16
|
839692.71
|
495436.41
|
927345.74
|
9.27
|
10.44
|
|
|
GRAND TOTAL
|
473321.02
|
875683.13
|
516321.52
|
967510.51
|
9.08
|
10.49
|
Note 1: Grand total is inclusive of component ‘Other’.
Note 2: The figures for MAY’24 are provisional.
QUICK ESTIMATES FOR SELECTED COUNTRIES FOR MAY 2024
TRADE: EXPORT
|
Sl. No.
|
Countries
|
(Values in Million USD)
|
% Change
|
|
MAY'23
|
APR'23-MAY'23
|
MAY'24
|
APR'24-MAY'24
|
MAY'24
|
APR'24-MAY'24
|
|
1
|
U S A
|
6573.41
|
12467.43
|
7432.21
|
14045.46
|
13.06
|
12.66
|
|
2
|
U ARAB EMTS
|
2568.17
|
4791.93
|
3067.14
|
5566.35
|
19.43
|
16.16
|
|
3
|
NETHERLAND
|
1522.98
|
3264.45
|
2191.83
|
4598.54
|
43.92
|
40.87
|
|
4
|
U K
|
1029.22
|
2146.36
|
1374.43
|
2620.39
|
33.54
|
22.09
|
|
5
|
CHINA P RP
|
1284.91
|
2673.96
|
1327.99
|
2581.58
|
3.35
|
-3.45
|
|
6
|
SINGAPORE
|
977.09
|
1824.50
|
1022.38
|
2493.13
|
4.64
|
36.65
|
|
7
|
SAUDI ARAB
|
1034.76
|
1969.05
|
1122.29
|
2072.78
|
8.46
|
5.27
|
|
8
|
BANGLADESH PR
|
862.77
|
1719.15
|
978.96
|
1784.74
|
13.47
|
3.82
|
|
9
|
GERMANY
|
811.67
|
1607.95
|
866.38
|
1641.96
|
6.74
|
2.12
|
|
10
|
FRANCE
|
529.03
|
1060.44
|
724.46
|
1488.79
|
36.94
|
40.39
|
|
11
|
MALAYSIA
|
424.74
|
901.36
|
794.06
|
1478.49
|
86.95
|
64.03
|
|
12
|
SOUTH AFRICA
|
703.32
|
1431.02
|
677.94
|
1389.59
|
-3.61
|
-2.90
|
|
13
|
ITALY
|
860.01
|
1716.42
|
689.60
|
1372.91
|
-19.82
|
-20.01
|
|
14
|
NEPAL
|
678.74
|
1337.99
|
607.73
|
1197.87
|
-10.46
|
-10.47
|
|
15
|
BRAZIL
|
634.57
|
1276.62
|
667.38
|
1152.87
|
5.17
|
-9.69
|
|
16
|
TURKEY
|
585.72
|
1247.56
|
681.43
|
1136.12
|
16.34
|
-8.93
|
|
17
|
BELGIUM
|
733.36
|
1308.08
|
472.94
|
1047.29
|
-35.51
|
-19.94
|
|
18
|
MEXICO
|
441.66
|
853.36
|
512.69
|
999.50
|
16.08
|
17.13
|
|
19
|
AUSTRALIA
|
538.18
|
1259.39
|
519.25
|
956.55
|
-3.52
|
-24.05
|
|
20
|
HONG KONG
|
487.07
|
1013.19
|
518.38
|
928.15
|
6.43
|
-8.39
|
|
|
Sub-Total
|
23281.40
|
45870.21
|
26249.47
|
50553.05
|
12.75
|
10.21
|
|
|
GRAND TOTAL
|
34952.48
|
69570.93
|
38132.48
|
73116.68
|
9.10
|
5.10
|
Note 1: Grand total is inclusive of all countries.
Note 2: The figures for MAY’24 are provisional.
QUICK ESTIMATES FOR SELECTED COUNTRIES FOR MAY 2024
TRADE: IMPORT
|
Sl. No.
|
Countries
|
(Values in Million USD)
|
% Change
|
|
MAY'23
|
APR'23-MAY'23
|
MAY'24
|
APR'24-MAY'24
|
MAY'24
|
APR'24-MAY'24
|
|
1
|
CHINA P RP
|
8250.12
|
15750.29
|
8482.59
|
16276.97
|
2.82
|
3.34
|
|
2
|
RUSSIA
|
6022.50
|
10307.80
|
7107.75
|
12358.18
|
18.02
|
19.89
|
|
3
|
U ARAB EMTS
|
3493.28
|
6642.07
|
5237.55
|
8556.70
|
49.93
|
28.83
|
|
4
|
U S A
|
3761.54
|
6818.76
|
3776.69
|
6983.76
|
0.40
|
2.42
|
|
5
|
IRAQ
|
2369.81
|
4625.93
|
3760.46
|
6204.50
|
58.68
|
34.12
|
|
6
|
SAUDI ARAB
|
2501.24
|
5613.21
|
2398.53
|
5591.29
|
-4.11
|
-0.39
|
|
7
|
INDONESIA
|
1950.79
|
3710.33
|
2406.55
|
4281.00
|
23.36
|
15.38
|
|
8
|
SWITZERLAND
|
2250.04
|
2945.99
|
1522.61
|
3724.72
|
-32.33
|
26.43
|
|
9
|
KOREA RP
|
1594.66
|
3189.11
|
1806.73
|
3352.57
|
13.30
|
5.13
|
|
10
|
SINGAPORE
|
1501.47
|
3051.37
|
1633.29
|
3202.70
|
8.78
|
4.96
|
|
11
|
JAPAN
|
1552.49
|
3059.08
|
1549.97
|
3039.38
|
-0.16
|
-0.64
|
|
12
|
GERMANY
|
1819.30
|
3244.40
|
1296.08
|
2502.57
|
-28.76
|
-22.87
|
|
13
|
HONG KONG
|
1355.82
|
2438.56
|
1306.96
|
2428.74
|
-3.60
|
-0.40
|
|
14
|
QATAR
|
956.75
|
2013.00
|
1245.48
|
2315.09
|
30.18
|
15.01
|
|
15
|
SOUTH AFRICA
|
1015.09
|
1714.66
|
1125.75
|
2140.04
|
10.90
|
24.81
|
|
16
|
AUSTRALIA
|
1450.62
|
2503.03
|
998.42
|
1997.20
|
-31.17
|
-20.21
|
|
17
|
MALAYSIA
|
1027.77
|
1869.54
|
993.92
|
1969.25
|
-3.29
|
5.33
|
|
18
|
THAILAND
|
850.23
|
1773.29
|
875.40
|
1811.10
|
2.96
|
2.13
|
|
19
|
TAIWAN
|
605.62
|
1244.25
|
882.77
|
1778.04
|
45.76
|
42.90
|
|
20
|
KUWAIT
|
743.94
|
1405.90
|
933.21
|
1566.58
|
25.44
|
11.43
|
|
|
Sub-Total
|
45073.07
|
83920.59
|
49340.72
|
92080.38
|
9.47
|
9.72
|
|
|
GRAND TOTAL
|
57481.42
|
106537.53
|
61914.33
|
116009.84
|
7.71
|
8.89
|
Note 1: Grand total is inclusive of all countries.
Note 2: The figures for MAY’24 are provisional.
*Link for Quick Estimates
***
ADVN
(रिलीज़ आईडी: 2025292)
आगंतुक पटल : 11178