Ministry of Environment, Forest and Climate Change
2023 - Air Quality Perspective in Delhi
प्रविष्टि तिथि:
31 DEC 2023 5:39PM by PIB Delhi
The Commission for Air Quality Management in NCR and Adjoining Areas (CAQM), since its inception in 2021, through a series of firm steps, has initiated various policy measures and field actions towards abatement of air pollution in Delhi-NCR.
Continual and concerted efforts of all the stakeholders round the year also in 2023 have further helped to improve the general air quality parameters in Delhi as compared to the past few years (barring the periods of very low anthropogenic, industrial and commercial activities during the Covid affected year 2020, owing to complete lockdowns and other restrictions), pursuant to various preventive and mitigative field actions through numerous statutory directions and orders of the Commission, covering all major sectors contributing to the overall air quality.
Comparative air quality related parameters for the years starting 2018 onwards follow as tabulated under:
Month-wise Daily Avg. AQI for Delhi
|
Month
|
2018
|
2019
|
2020
|
2021
|
2022
|
2023
|
|
January
|
328
|
328
|
286
|
324
|
279
|
311
|
|
February
|
243
|
242
|
241
|
288
|
225
|
237
|
|
March
|
203
|
184
|
128
|
223
|
217
|
170
|
|
April
|
222
|
211
|
110
|
202
|
255
|
179
|
|
May
|
217
|
221
|
144
|
144
|
212
|
171
|
|
June
|
202
|
189
|
123
|
147
|
190
|
130
|
|
July
|
104
|
134
|
84
|
110
|
87
|
84
|
|
August
|
111
|
86
|
64
|
107
|
93
|
116
|
|
September
|
112
|
98
|
116
|
78
|
104
|
108
|
|
October
|
269
|
234
|
266
|
173
|
210
|
219
|
|
November
|
335
|
312
|
328
|
377
|
320
|
373
|
|
December
|
360
|
337
|
332
|
336
|
319
|
348
|
Barring 2020, the year 2023 witnessed 4 months (March, April, June and July) with best ever daily average AQI and 3 months (January, February and May) with second best daily average AQI during the entire period from 2018 to 2023.
Daily Avg. AQI for Delhi during the entire year
|
Year
|
2018
|
2019
|
2020
|
2021
|
2022
|
2023
|
|
Daily Avg. AQI
|
225
|
215
|
185
|
209
|
209
|
204
|

The average daily AQI for Delhi during the entire year 2023 has been the best so far since 2018 and even before that, barring 2020, which saw an exceptional AQI owing to continued spells of lockdown and low anthropogenic activities round the year.
Comparative PM10 and PM2.5 Concentrations
As per IMD data, comparative daily average Particulate Matter emission concentration (PM2.5 and PM10) values in Delhi read as under:
|
Year
|
Daily avg. PM10 (µgm/m3)
|
Daily avg. PM2.5 (µgm/m3)
|
|
2018
|
242
|
114
|
|
2019
|
217
|
108
|
|
2020*
|
180
|
94
|
|
2021
|
210
|
104
|
|
2022
|
211
|
98
|
|
2023
|
205
|
100
|
* Covid Year

The Year 2023 has thus witnessed the lowest ever recorded daily average values for PM10 and the second best PM2.5 concentrations, barring the Covid affected 2020 with lowest anthropogenic activities.
Comparative AQI Category status for Delhi
|
AQI Category
|
No. of Days
|
|
2018
|
2019
|
2020
|
2021
|
2022
|
2023
|
2018
|
2019
|
2020
|
2021
|
2022
|
2023
|
|
Good
(0-50)
|
0
|
2
|
5
|
1
|
3
|
1
|
159
|
182
|
227
|
197
|
163
|
206
|
|
Satisfactory
(51-100)
|
53
|
59
|
95
|
72
|
65
|
60
|
|
Moderate
(101-200)
|
106
|
121
|
127
|
124
|
95
|
145
|
|
Poor
(201-300)
|
114
|
103
|
75
|
80
|
130
|
77
|
186
|
159
|
124
|
144
|
196
|
144
|
|
Very Poor
(201-300)
|
72
|
56
|
49
|
64
|
66
|
67
|
|
Severe
401-450)
|
20
|
19
|
13
|
20
|
6
|
13
|
20
|
24
|
15
|
24
|
6
|
15
|
|
Severe +
>450
|
0
|
5
|
2
|
4
|
0
|
2
|

As per the CPCB criteria for the air quality category based on gradation of the daily average AQI, the year 2023 witnessed the best ever “Good to Moderate” AQI days , registering a mark of more than 200 days (barring Covid affected 2020).
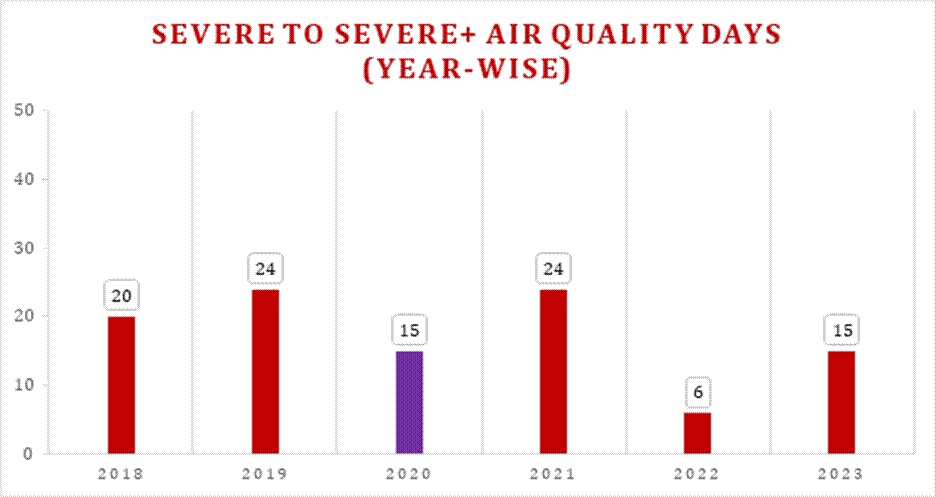
The number of days with Severe – Severe + AQI were 15 during 2023, which is also the second-best figure for the period between 2018 – 2023.
Comparative Delhi AQI around Diwali Festival
|
Year
|
Pre-Diwali Day
|
Diwali Day
|
Post-Diwali Day
|
|
2018
|
338
|
281
|
390
|
|
2019
|
287
|
337
|
368
|
|
2020
|
339
|
414
|
435
|
|
2021
|
314
|
382
|
462
|
|
2022
|
259
|
312
|
302
|
|
2023
|
220
|
218
|
358
|
The above tabulation indicates best ever AQI in Delhi around the Diwali festival in 2023.
The year 2023 also witnessed much lower levels of episodic events like farm burnings during paddy harvesting season, bursting of crackers during religious festivals and marriages/celebrations etc. However, the benefit attributable to the same in Delhi’s AQI, was nullified owing to much adverse climatic, meteorological, low temperature and calm wind conditions in the region, impeding effective dispersion of the pollutants and resulting in a spike in the daily average AQI during the winter months in particular. Despite these factors, the overall daily average AQI during the year has been the best so far.
With persistent field level efforts and targeted policy initiatives for quantified results in the short/ medium/ long term, it is expected that air quality scenario over Delhi will see further gradual but marked improvement, year on year.
MJPS
(रिलीज़ आईडी: 1991970)
आगंतुक पटल : 36147