|
Ministry of Commerce & Industry
India’s overall exports in August 2023 estimated at USD 60.87 Billion; Merchandise exports estimated at USD 34.48 Billion in August 2023, despite global sluggish growth
Overall Trade Deficit is projected to improve by 37.85% during April-August 2023; Merchandise trade deficit also improves from USD 112.85 Billion during April-August 2022 to USD 98.88 Billion in April-August 2023 Engineering Goods exports record a growth of 7.73% from USD 8.41 Billion in August 2022 to USD 9.05 Billion in August 2023 Electronic Goods exports register growth of 26.29% and 35.22% in August 2023 and April-August 2023 Ceramic products & glasswareexports grow by29.28% in August 2023 and 15.74% in April-August 2023 Drugs and pharma exports continue to grow at 4.53% in August 2023 Agricultural exports registered robust growth in August 2023: Oil Meals (57.26%), Tobacco (20.03%), Oil Seeds (17.02%), Meat, Dairy & Poultry Products (16.46%), Cashew (14.25%), Fruits & Vegetables (14.19%), Cereal Preparations & Miscellaneous Processed Items (12.88%)
प्रविष्टि तिथि:
15 SEP 2023 5:26PM by PIB Delhi
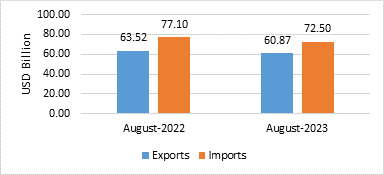
- India’s overall exports (Merchandise and Services combined) in August 2023* is estimated to be USD 60.87 Billion, exhibiting a negative growth of (-) 4.17 per cent over August 2022. Overall imports in August 2023* is estimated to be USD 72.50 Billion, exhibiting a negative growth of (-) 5.97 per cent over August 2022.
Table 1: Trade during August 2023*
|
|
|
August 2023
(USD Billion)
|
August 2022
(USD Billion)
|
|
Merchandise
|
Exports
|
34.48
|
37.02
|
|
Imports
|
58.64
|
61.88
|
|
Services*
|
Exports
|
26.39
|
26.50
|
|
Imports
|
13.86
|
15.22
|
|
Overall Trade
(Merchandise +Services) *
|
Exports
|
60.87
|
63.52
|
|
Imports
|
72.50
|
77.10
|
|
Trade Balance
|
-11.63
|
-13.58
|
* Note: The latest data for services sector released by RBI is for July 2023. The data for August 2023 is an estimation, which will be revised based on RBI’s subsequent release. (ii) Data for April-August 2022 has been revised on pro-rata basis using quarterly balance of payments data.
Fig 1: Overall Trade during August 2023*
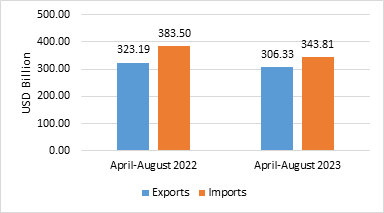
- India’s overall exports (Merchandise and Services combined) in April-August 2023 is estimated to exhibit a negative growth of (-) 5.22 per cent over April-August 2022. Overall imports in April-August 2023 is estimated to exhibit a negative growth of (-) 10.35 per cent over April-August 2022.
Table 2: Trade during April-August 2023*
|
|
|
April-August 2023
(USD Billion)
|
April-August 2022
(USD Billion)
|
|
Merchandise
|
Exports
|
172.95
|
196.33
|
|
Imports
|
271.83
|
309.19
|
|
Services*
|
Exports
|
133.38
|
126.85
|
|
Imports
|
71.98
|
74.31
|
|
Overall Trade (Merchandise+Services) *
|
Exports
|
306.33
|
323.19
|
|
Imports
|
343.81
|
383.50
|
|
Trade Balance
|
-37.49
|
-60.31
|
Fig 2: Overall Trade during April-August 2023*
MERCHANDISE TRADE
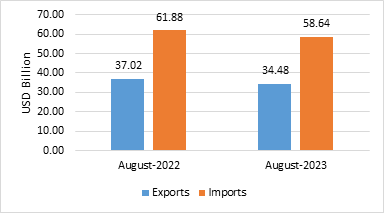
- Merchandise exports in August 2023 were USD 34.48 Billion, as compared to USD 37.02 Billion in August 2022.
- Merchandise imports in August 2023 were USD 58.64 Billion, as compared to USD 61.88 Billion in August 2022.
Fig 3: Merchandise Trade during August 2023
- Merchandise exports for the period April-August 2023 were USD 172.95 Billion as against USD 196.33 Billion during April-August 2022.
- Merchandise imports for the period April-August 2023 were USD 271.83 Billion as against USD 309.19 Billion during April-August 2022.
- The merchandise trade deficit for April-August 2023 was estimated at USD 98.88 Billion as against USD 112.85 Billion during April-August 2022.
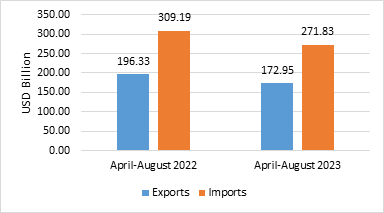
Fig 4: Merchandise Trade during April-August 2023
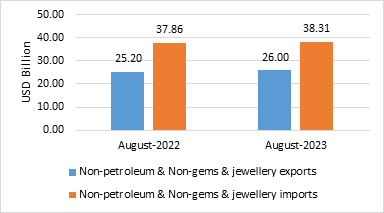
- Non-petroleum and non-gems & jewellery exports in August 2023 were USD 26.00 Billion, compared to USD 25.20 Billion in August 2022.
- Non-petroleum, non-gems & jewellery (gold, silver & precious metals) imports in August 2023 were USD 38.31 Billion, compared to USD 37.86 Billion in August 2022.
Table 3: Trade excluding Petroleum and Gems & Jewellery during August 2023
|
|
August 2023
(USD Billion)
|
August 2022
(USD Billion)
|
|
Non- petroleum exports
|
28.60
|
28.53
|
|
Non- petroleum imports
|
45.43
|
44.56
|
|
Non-petroleum & Non Gems & Jewellery exports
|
26.00
|
25.20
|
|
Non-petroleum & Non Gems & Jewellery imports
|
38.31
|
37.86
|
Note: Gems &Jewellery Imports include Gold, Silver & Pearls, precious & Semi-precious stones
Fig 5: Trade excluding Petroleum and Gems & Jewellery during August 2023
- Non-petroleum and non-gems & jewellery exports during April-August 2023 was USD 128.86 Billion, as compared to USD 135.92 Billion in April-August 2022.
- Non-petroleum, non-gems & jewellery (gold, silver & precious metals) imports were USD 174.80 Billion in April-August 2023 as compared to USD 186.64 Billion in April-August 2022.
Table 4: Trade excluding Petroleum and Gems & Jewellery during April-August 2023
|
|
April-August 2023
(USD Billion)
|
April-August 2022
(USD Billion)
|
|
Non- petroleum exports
|
141.29
|
152.76
|
|
Non- petroleum imports
|
203.54
|
220.12
|
|
Non-petroleum & Non Gems & Jewellery exports
|
128.86
|
135.92
|
|
Non-petroleum & Non Gems & Jewellery imports
|
174.80
|
186.64
|
Note: Gems &Jewellery Imports include Gold, Silver & Pearls, precious & Semi-precious stones
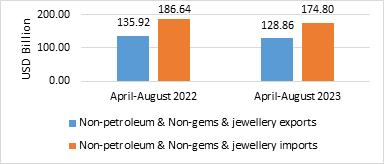
Fig 6: Trade excluding Petroleum and Gems & Jewellery during April-August 2023
SERVICES TRADE
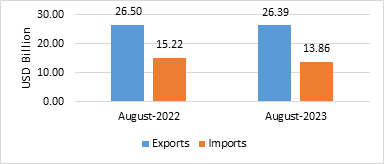
- The estimated value of services export for August 2023* is USD 26.39 Billion, as compared to USD 26.50 Billion in August 2022.
- The estimated value of services import for August 2023* is USD 13.86 Billion as compared to USD 15.22 Billion in August 2022.
Fig 7: Services Trade during August 2023*
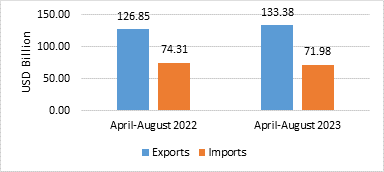
- The estimated value of services export for April-August 2023* is USD 133.38 Billion as compared to USD 126.85 Billion in April-August 2022.
- The estimated value of services imports for April-August 2023* is USD 71.98 Billion as compared to USD 74.31 Billion in April-August 2022.
- The services trade surplus for April-August 2023* is estimated at USD 61.40 Billion as against USD 52.54 Billion in April-August 2022.
Fig 8: Services Trade during April-August 2023
- For the month of August 2023, undermerchandise exports, 15 of the 30 key sectors exhibited positive growth in August 2023 as compared to same period last year (August 2022). These include Iron Ore (1556.09%), Oil Meals (57.26%), Ceramic Products & Glassware (29.28%), Electronic Goods (26.29%), Cotton Yarn/Fabs./Made-Ups, Handloom Products Etc. (26%), Tobacco (20.03%), Oil Seeds (17.02%), Meat, Dairy & Poultry Products (16.46%), Cashew (14.25%), Fruits & Vegetables (14.19%), Carpet (13.15%), Cereal Preparations & Miscellaneous Processed Items (12.88%), Engineering Goods (7.73%), Drugs & Pharmaceuticals (4.53%) and Marine Products (2.45%).
- Exports of Electronic goods increased by 26.29 percent during August 2023 at USD 2.17 Billion as compared to USD 1.72 Billion in August 2022. During April-August 2023 electronic goods exports were recorded at USD 11.18 Billion as compared to USD 8.27 Billion during April-August 2022, registering a growth of 35.22 percent.
- Under merchandise imports, 15 out of 30 key sectors exhibited negative growth in August 2023. These include Silver (-78.15%), Cotton Raw & Waste (-74.67%), Fertilisers, Crude & Manufactured (-55.69%), Coal, Coke & Briquettes, Etc. (-43.47%), Leather & Leather Products (-33.17%), Organic & Inorganic Chemicals (-26.69%), Petroleum, Crude & Products (-23.76%), Textile Yarn Fabric, Made-Up Articles (-18.38%), Pearls, Precious & Semi-Precious Stones (-15.82%), Wood & Wood Products (-10.01%), Fruits & Vegetables (-8.08%), Transport Equipment (-3.99%), Sulphur & Unroasted Iron Pyrites (-3.21%), Pulp And Waste Paper (-1.25%) and Vegetable Oil (-0.49%).
- For April-August 2023, under merchandise exports, 12 of the 30 key sectors exhibited positive growth during April-August 2023 as compared to April-August 2022. These includeIron Ore (95.18%), Oil Meals (37.2%), Electronic Goods (35.22%), Oil Seeds (25.29%), Ceramic Products & Glassware (15.74%), Fruits & Vegetables (14.37%), Tobacco (7.23%), Spices (5.73%), Coffee (4.81%), Drugs & Pharmaceuticals (4.18%), Cashew (2.19%) and Rice (0.99%).
- Under merchandise imports, 17 of the 30 key sectors exhibited negative growth in April-August 2023 as compared to April-August 2022. These include Silver (-88.12%), Cotton Raw & Waste (-52.61%), Sulphur & Unroasted Iron Pyrites (-46.75%), Coal, Coke & Briquettes, Etc. (-37.16%), Fertilisers, Crude & Manufactured (-29.34%), Organic & Inorganic Chemicals (-27.25%), Pearls, Precious & Semi-Precious Stones (-26.52%), Petroleum, Crude & Products (-23.33%), Vegetable Oil (-23.16%), Textile Yarn Fabric, Made-Up Articles (-21.7%), Leather & Leather Products (-13.73%), Wood & Wood Products (-12.67%), Fruits & Vegetables (-11.55%), Artificial Resins, Plastic Materials, Etc. (-9.37%), Metaliferrous Ores & Other Minerals (-7.29%), Transport Equipment (-4.18%) and Medicinal & Pharmaceutical Products (-0.29%).
- Silver imports slumped by78.15 percent from USD 0.73 Billion in August 2022 to USD 0.16 Billion in August 2023.
- Services exports is projected to continue to grow positively at 5.14 percent during April-August 2023 over April-August2022.
- India’s trade deficit has shown considerable decline in April-August 2023. Overall trade deficit for April-August 2023* is estimated at USD 37.49 Billion as compared to the deficit of USD 60.31 Billion during April-August 2022, registering a decline of (-) 37.85 percent. The merchandise trade deficit during April-August 2023 was USD 98.88 Billion compared to USD 112.85 Billion during April-August 2022, registering a decline of (-) 12.38 percent.
Link for quick Estimates
***
AD/VN
(रिलीज़ आईडी: 1957756)
|