ਵਣਜ ਤੇ ਉਦਯੋਗ ਮੰਤਰਾਲਾ
8 ਕੋਰ ਉਦਯੋਗਾਂ ਦਾ ਸੂਚਕ ਅੰਕ (ਅਧਾਰ:2011-12=100) ਅਕਤੂਬਰ 2020
प्रविष्टि तिथि:
27 NOV 2020 5:00PM by PIB Chandigarh
ਆਰਥਿਕ ਸਲਾਹਕਾਰ ਦੇ ਦਫਤਰ, ਉਦਯੋਗ ਅਤੇ ਅੰਦਰੂਨੀ ਵਪਾਰ ਨੂੰ ਉਤਸ਼ਾਹਿਤ ਕਰਨ ਵਾਲੇ ਵਿਭਾਗ ਨੇ 8 ਕੋਰ ਉਦਯੋਗਾਂ ਦਾ ਅਕਤੂਬਰ 2020 ਲਈ ਸੂਚਕ ਅੰਕ ਜਾਰੀ ਕੀਤੇ ਹਨ ।
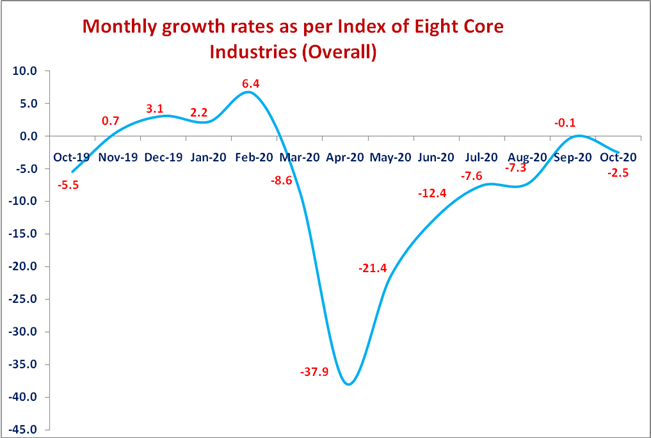
2. ਅਕਤੂਬਰ 2020 ਵਿੱਚ 8 ਕੋਰ ਉਦਯੋਗਾਂ ਦਾ ਸੰਯੁਕਤ ਇੰਡੈਕਸ 124.2 ਸੀ ਜੋ ਅਕਤੂਬਰ 2019 ਦੇ ਸੂਚਕ ਅੰਕ ਦੇ ਮੁਕਾਬਲੇ 2.5% (ਆਰਜੀ) ਘਟਿਆ ਹੈ ।ਅਪ੍ਰੈਲ ਤੋਂ ਅਕਤੂਬਰ 2020-21 ਵਿਚਾਲੇ ਇਹਨਾ ਦਾ ਕੁੱਲ ਵਾਧਾ (-)13.0% ਹੈ)।
3. ਜੁਲਾਈ 2020 ਲਈ 8 ਕੋਰ ਉਦਯੋਗਾਂ ਦੇ ਸੂਚਕ ਅੰਕ ਦੀ ਅੰਤਿਮ ਵਿਕਾਸ ਦਰ (-)7.6% ਫਿਰ ਤੋਂ ਨਿਰਧਾਰਤ ਕੀਤੀ ਗਈ ਹੈ ।
8 ਕੋਰ ਉਦਯੋਗਾਂ ਦੇ ਉਦਯੋਗਿਕ ਉਤਪਾਦਨ ਦੇ ਸੂਚਕ ਅੰਕ (ਆਈ.ਆਈ.ਪੀ.) ਵਿੱਚ ਸ਼ਾਮਲ ਆਈਟਮਾਂ ਦੇ ਭਾਰ ਦਾ 40.27% ਹੈ । ਸਾਲਾਨਾ/ਮਹੀਨਾਵਾਰ ਸੂਚਕ ਅੰਕ ਅਤੇ ਵਿਕਾਸ ਦਰ ਗ੍ਰਾਫ ਵਿੱਚ ਦਿੱਤੀ ਗਈ ਹੈ ।
Annexure
Performance of Eight Core Industries
Yearly Index & Growth Rate
Base Year: 2011-12=100
Index
|
Sector
|
Weight
|
2012-13
|
2013-14
|
2014-15
|
2015-16
|
2016-17
|
2017-18
|
2018-19
|
2019-20
|
Apr- Oct 2019-20
|
Apr- Oct 2020-21
|
|
Coal
|
10.3335
|
103.2
|
104.2
|
112.6
|
118.0
|
121.8
|
124.9
|
134.1
|
133.6
|
110.2
|
106.3
|
|
Crude Oil
|
8.9833
|
99.4
|
99.2
|
98.4
|
97.0
|
94.5
|
93.7
|
89.8
|
84.5
|
86.0
|
80.7
|
|
Natural Gas
|
6.8768
|
85.6
|
74.5
|
70.5
|
67.2
|
66.5
|
68.4
|
69.0
|
65.1
|
66.8
|
58.4
|
|
Refinery Products
|
28.0376
|
107.2
|
108.6
|
108.8
|
114.1
|
119.7
|
125.2
|
129.1
|
129.4
|
127.3
|
106.4
|
|
Fertilizers
|
2.6276
|
96.7
|
98.1
|
99.4
|
106.4
|
106.6
|
106.6
|
107.0
|
109.8
|
108.3
|
112.8
|
|
Steel
|
17.9166
|
107.9
|
115.8
|
121.7
|
120.2
|
133.1
|
140.5
|
147.7
|
152.6
|
152.8
|
117.9
|
|
Cement
|
5.3720
|
107.5
|
111.5
|
118.1
|
123.5
|
122.0
|
129.7
|
147.0
|
145.7
|
141.7
|
111.6
|
|
Electricity
|
19.8530
|
104.0
|
110.3
|
126.6
|
133.8
|
141.6
|
149.2
|
156.9
|
158.4
|
164.9
|
155.6
|
|
Overall Index
|
100.0000
|
103.8
|
106.5
|
111.7
|
115.1
|
120.5
|
125.7
|
131.2
|
131.6
|
130.0
|
113.1
|
Growth Rates (in per cent)
|
Sector
|
Weight
|
2012-13
|
2013-14
|
2014-15
|
2015-16
|
2016-17
|
2017-18
|
2018-19
|
2019-20
|
Apr- Oct 2019-20
|
Apr- Oct 2020-21
|
|
Coal
|
10.3335
|
3.2
|
1.0
|
8.0
|
4.8
|
3.2
|
2.6
|
7.4
|
-0.4
|
-5.8
|
-3.6
|
|
Crude Oil
|
8.9833
|
-0.6
|
-0.2
|
-0.9
|
-1.4
|
-2.5
|
-0.9
|
-4.1
|
-5.9
|
-5.8
|
-6.1
|
|
Natural Gas
|
6.8768
|
-14.4
|
-12.9
|
-5.3
|
-4.7
|
-1.0
|
2.9
|
0.8
|
-5.6
|
-2.6
|
-12.5
|
|
Refinery Products
|
28.0376
|
7.2
|
1.4
|
0.2
|
4.9
|
4.9
|
4.6
|
3.1
|
0.2
|
-1.7
|
-16.4
|
|
Fertilizers
|
2.6276
|
-3.3
|
1.5
|
1.3
|
7.0
|
0.2
|
0.03
|
0.3
|
2.7
|
2.6
|
4.1
|
|
Steel
|
17.9166
|
7.9
|
7.3
|
5.1
|
-1.3
|
10.7
|
5.6
|
5.1
|
3.4
|
6.7
|
-22.8
|
|
Cement
|
5.3720
|
7.5
|
3.7
|
5.9
|
4.6
|
-1.2
|
6.3
|
13.3
|
-0.9
|
-0.6
|
-21.3
|
|
Electricity
|
19.8530
|
4.0
|
6.1
|
14.8
|
5.7
|
5.8
|
5.3
|
5.2
|
0.9
|
1.5
|
-5.6
|
|
Overall Growth
|
100.0000
|
3.8
|
2.6
|
4.9
|
3.0
|
4.8
|
4.3
|
4.4
|
0.4
|
0.3
|
-13.0
|
Performance of Eight Core Industries
Monthly Index & Growth Rate
Base Year: 2011-12=100
Index
|
Sector
|
Coal
|
Crude Oil
|
Natural Gas
|
Refinery Products
|
Fertilizers
|
Steel
|
Cement
|
Electricity
|
Overall Index
|
|
Weight
|
10.3335
|
8.9833
|
6.8768
|
28.0376
|
2.6276
|
17.9166
|
5.3720
|
19.8530
|
100.0000
|
|
Oct-19
|
109.6
|
86.3
|
66.3
|
134.2
|
115.5
|
149.5
|
137.0
|
145.8
|
127.4
|
|
Nov-19
|
133.6
|
82.4
|
64.4
|
133.0
|
116.7
|
154.9
|
142.4
|
139.9
|
129.2
|
|
Dec-19
|
152.9
|
83.5
|
65.5
|
130.5
|
120.5
|
165.2
|
159.2
|
150.2
|
135.5
|
|
Jan-20
|
164.7
|
85.0
|
65.3
|
134.4
|
116.5
|
155.4
|
164.1
|
155.6
|
137.4
|
|
Feb-20
|
171.1
|
75.6
|
58.3
|
128.9
|
107.8
|
152.9
|
160.7
|
153.6
|
134.0
|
|
Mar-20
|
209.7
|
85.0
|
60.1
|
135.3
|
98.3
|
133.2
|
129.8
|
146.9
|
134.0
|
|
Apr-20
|
103.7
|
80.2
|
53.3
|
94.2
|
85.0
|
26.9
|
22.5
|
125.6
|
81.2
|
|
May-20
|
109.4
|
82.0
|
57.2
|
102.0
|
113.4
|
96.4
|
117.3
|
150.6
|
107.7
|
|
Jun-20
|
104.3
|
79.6
|
58.1
|
110.6
|
114.6
|
122.3
|
137.8
|
156.2
|
116.3
|
|
Jul-20
|
100.3
|
83.0
|
61.2
|
114.5
|
119.4
|
141.9
|
126.8
|
166.3
|
122.5
|
|
Aug-20
|
98.3
|
81.2
|
61.0
|
105.9
|
120.8
|
147.4
|
109.1
|
162.7
|
119.1
|
|
Sep-20
|
105.8
|
78.3
|
57.5
|
106.3
|
113.5
|
145.1
|
126.7
|
166.4
|
120.5
|
|
Oct-20
|
122.2
|
80.9
|
60.6
|
111.5
|
122.8
|
145.4
|
140.9
|
161.1
|
124.2
|
Growth Rates (in per cent)
|
Sector
|
Coal
|
Crude Oil
|
Natural Gas
|
Refinery Products
|
Fertilizers
|
Steel
|
Cement
|
Electricity
|
Overall Growth
|
|
Weight
|
10.3335
|
8.9833
|
6.8768
|
28.0376
|
2.6276
|
17.9166
|
5.3720
|
19.8530
|
100.0000
|
|
Oct-19
|
-17.6
|
-5.1
|
-5.6
|
0.4
|
11.8
|
-0.5
|
-7.7
|
-12.2
|
-5.5
|
|
Nov-19
|
-3.5
|
-6.0
|
-6.4
|
3.1
|
13.6
|
7.0
|
4.3
|
-4.9
|
0.7
|
|
Dec-19
|
6.1
|
-7.4
|
-9.2
|
3.0
|
10.2
|
8.7
|
5.5
|
0.0
|
3.1
|
|
Jan-20
|
8.0
|
-5.3
|
-9.0
|
1.9
|
-0.1
|
1.6
|
5.1
|
3.2
|
2.2
|
|
Feb-20
|
11.3
|
-6.4
|
-9.6
|
7.4
|
2.9
|
2.9
|
7.8
|
11.5
|
6.4
|
|
Mar-20
|
4.0
|
-5.5
|
-15.1
|
-0.5
|
-11.9
|
-21.9
|
-25.1
|
-8.2
|
-8.6
|
|
Apr-20
|
-15.5
|
-6.4
|
-19.9
|
-24.2
|
-4.5
|
-82.8
|
-85.2
|
-22.9
|
-37.9
|
|
May-20
|
-14.0
|
-7.1
|
-16.8
|
-21.3
|
7.5
|
-40.4
|
-21.4
|
-14.8
|
-21.4
|
|
Jun-20
|
-15.5
|
-6.0
|
-12.0
|
-8.9
|
4.2
|
-23.2
|
-6.8
|
-10.0
|
-12.4
|
|
Jul-20
|
-5.7
|
-4.9
|
-10.2
|
-13.9
|
6.9
|
-6.5
|
-13.5
|
-2.4
|
-7.6
|
|
Aug-20
|
3.6
|
-6.3
|
-9.5
|
-19.1
|
7.3
|
-1.7
|
-14.5
|
-1.8
|
-7.3
|
|
Sep-20
|
21.2
|
-6.0
|
-10.6
|
-9.5
|
-0.3
|
2.8
|
-3.5
|
4.8
|
-0.1
|
|
Oct-20
|
11.6
|
-6.2
|
-8.6
|
-17.0
|
6.3
|
-2.7
|
2.8
|
10.5
|
-2. 5
|
*****
ਵਾਈ.ਬੀ./ਏ.ਪੀ.
(रिलीज़ आईडी: 1676570)
आगंतुक पटल : 259