वाणिज्य आणि उदयोग मंत्रालय
जून 2020 साठी आठ प्रमुख उद्योगांचे निर्देशांक (आधार:2011-12=100)
प्रविष्टि तिथि:
31 JUL 2020 6:53PM by PIB Mumbai
उद्योग आणि अंतर्गत व्यापार प्रोत्साहन विभागाच्या आर्थिक सल्लागार कार्यालयाने जून 2020 महिन्यासाठी आठ प्रमुख उद्योगांचा निर्देशांक जारी केला आहे.
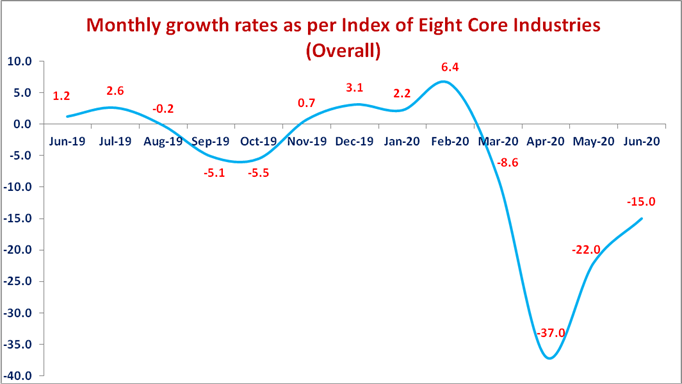
2. जून 2020 मध्ये आठ प्रमुख उद्योगांच्या निर्देशांकातील वाढीचा दर मे 2020 महिन्यातील 22.0 % (सुधारित) घसरणीच्या तुलनेत 15.0 %(अंदाजे ) ने कमी झाला आहे. एप्रिल ते जून 2020-21 दरम्यान त्याची एकत्रित वाढ - 24.6%.राहिली.
3 मार्च 2020 साठी आठ प्रमुख उद्योगांच्या निर्देशांकाचा सुधारित अंतिम वृद्धी दर -8.6 % आहे. औद्योगिक उत्पादनाच्या निर्देशांकात (आयआयपी) मध्ये समाविष्ट असलेल्या वस्तूंच्या भारापैकी आठ- प्रमुख उद्योगांचा भार 40.27 टक्के इतका आहे. वार्षिक / मासिक निर्देशांक आणि विकास दराचा तपशील जोडपत्रात दिला आहे. .
4. आठ प्रमुख उद्योगांच्या (एकूण) निर्देशांकातील मासिक वाढीचे दर आलेखात दर्शविले आहेतः
Annexure
Performance of Eight Core Industries
Yearly Index & Growth Rate
Base Year: 2011-12=100
Index
|
Sector
|
Weight
|
2012-13
|
2013-14
|
2014-15
|
2015-16
|
2016-17
|
2017-18
|
2018-19
|
2019-20
|
Apr-Jun 2019-20
|
Apr-Jun 2020-21
|
|
Coal
|
10.3335
|
103.2
|
104.2
|
112.6
|
118.0
|
121.8
|
124.9
|
134.1
|
133.6
|
124.5
|
105.8
|
|
Crude Oil
|
8.9833
|
99.4
|
99.2
|
98.4
|
97.0
|
94.5
|
93.7
|
89.8
|
84.5
|
86.2
|
80.6
|
|
Natural Gas
|
6.8768
|
85.6
|
74.5
|
70.5
|
67.2
|
66.5
|
68.4
|
69.0
|
65.1
|
67.1
|
56.2
|
|
Refinery Products
|
28.0376
|
107.2
|
108.6
|
108.8
|
114.1
|
119.7
|
125.2
|
129.1
|
129.4
|
125.1
|
102.3
|
|
Fertilizers
|
2.6276
|
96.7
|
98.1
|
99.4
|
106.4
|
106.6
|
106.6
|
107.0
|
109.8
|
101.5
|
104.3
|
|
Steel
|
17.9166
|
107.9
|
115.8
|
121.7
|
120.2
|
133.1
|
140.5
|
147.7
|
152.6
|
159.2
|
76.9
|
|
Cement
|
5.3720
|
107.5
|
111.5
|
118.1
|
123.5
|
122.0
|
129.7
|
147.0
|
145.7
|
149.9
|
92.5
|
|
Electricity
|
19.8530
|
104.0
|
110.3
|
126.6
|
133.8
|
141.6
|
149.2
|
156.9
|
158.4
|
171.1
|
143.5
|
|
Overall Index
|
100.0000
|
103.8
|
106.5
|
111.7
|
115.1
|
120.5
|
125.7
|
131.2
|
131.6
|
133.5
|
100.7
|
Growth Rates (in per cent)
|
Sector
|
Weight
|
2012-13
|
2013-14
|
2014-15
|
2015-16
|
2016-17
|
2017-18
|
2018-19
|
2019-20
|
Apr-Jun 2019-20
|
Apr-Jun 2020-21
|
|
Coal
|
10.3335
|
3.2
|
1.0
|
8.0
|
4.8
|
3.2
|
2.6
|
7.4
|
-0.4
|
2.6
|
-15.0
|
|
Crude Oil
|
8.9833
|
-0.6
|
-0.2
|
-0.9
|
-1.4
|
-2.5
|
-0.9
|
-4.1
|
-5.9
|
-6.8
|
-6.5
|
|
Natural Gas
|
6.8768
|
-14.4
|
-12.9
|
-5.3
|
-4.7
|
-1.0
|
2.9
|
0.8
|
-5.6
|
-1.0
|
-16.2
|
|
Refinery Products
|
28.0376
|
7.2
|
1.4
|
0.2
|
4.9
|
4.9
|
4.6
|
3.1
|
0.2
|
-2.4
|
-18.2
|
|
Fertilizers
|
2.6276
|
-3.3
|
1.5
|
1.3
|
7.0
|
0.2
|
0.03
|
0.3
|
2.7
|
-1.1
|
2.8
|
|
Steel
|
17.9166
|
7.9
|
7.3
|
5.1
|
-1.3
|
10.7
|
5.6
|
5.1
|
3.4
|
12.4
|
-51.7
|
|
Cement
|
5.3720
|
7.5
|
3.7
|
5.9
|
4.6
|
-1.2
|
6.3
|
13.3
|
-0.9
|
1.0
|
-38.3
|
|
Electricity
|
19.8530
|
4.0
|
6.1
|
14.8
|
5.7
|
5.8
|
5.3
|
5.2
|
0.9
|
7.3
|
-16.1
|
|
Overall Growth
|
100.0000
|
3.8
|
2.6
|
4.9
|
3.0
|
4.8
|
4.3
|
4.4
|
0.4
|
3.4
|
-24.6
|
Performance of Eight Core Industries
Monthly Index & Growth Rate
Base Year: 2011-12=100
Index
|
Sector
|
Coal
|
Crude Oil
|
Natural Gas
|
Refinery Products
|
Fertilizers
|
Steel
|
Cement
|
Electricity
|
Overall Index
|
|
Weight
|
10.3335
|
8.9833
|
6.8768
|
28.0376
|
2.6276
|
17.9166
|
5.3720
|
19.8530
|
100.0000
|
|
Jun-19
|
123.5
|
84.7
|
66.0
|
121.4
|
110.0
|
159.3
|
147.9
|
173.6
|
132.8
|
|
Jul-19
|
106.4
|
87.2
|
68.1
|
132.9
|
111.7
|
151.7
|
146.5
|
170.5
|
132.6
|
|
Aug-19
|
94.8
|
86.6
|
67.4
|
131.0
|
112.6
|
150.0
|
127.7
|
165.7
|
128.5
|
|
Sep-19
|
87.3
|
83.4
|
64.3
|
117.5
|
113.9
|
141.2
|
131.3
|
158.7
|
120.7
|
|
Oct-19
|
109.6
|
86.3
|
66.3
|
134.2
|
115.5
|
149.5
|
137.0
|
145.8
|
127.4
|
|
Nov-19
|
133.6
|
82.4
|
64.4
|
133.0
|
116.7
|
154.9
|
142.4
|
139.9
|
129.2
|
|
Dec-19
|
152.9
|
83.5
|
65.5
|
130.5
|
120.5
|
165.2
|
159.2
|
150.2
|
135.5
|
|
Jan-20
|
164.7
|
85.0
|
65.3
|
134.4
|
116.5
|
155.4
|
164.1
|
155.6
|
137.4
|
|
Feb-20
|
171.1
|
75.6
|
58.3
|
128.9
|
107.8
|
152.9
|
160.7
|
153.6
|
134.0
|
|
Mar-20
|
209.7
|
85.0
|
60.1
|
135.3
|
98.3
|
133.2
|
129.8
|
146.9
|
134.0
|
|
Apr-20
|
103.7
|
80.2
|
53.3
|
94.2
|
85.0
|
33.3
|
22.5
|
125.5
|
82.3
|
|
May-20
|
109.4
|
82.0
|
57.2
|
102.0
|
113.4
|
92.1
|
117.3
|
150.6
|
106.9
|
|
Jun-20
|
104.3
|
79.6
|
58.1
|
110.6
|
114.6
|
105.4
|
137.7
|
154.5
|
112.9
|
Growth Rates (in per cent)
|
Sector
|
Coal
|
Crude Oil
|
Natural Gas
|
Refinery Products
|
Fertilizers
|
Steel
|
Cement
|
Electricity
|
Overall Growth
|
|
Weight
|
10.3335
|
8.9833
|
6.8768
|
28.0376
|
2.6276
|
17.9166
|
5.3720
|
19.8530
|
100.0000
|
|
Jun-19
|
2.9
|
-6.8
|
-2.1
|
-9.3
|
1.5
|
10.8
|
-1.9
|
8.6
|
1.2
|
|
Jul-19
|
-1.6
|
-4.4
|
-0.5
|
-0.9
|
1.5
|
8.1
|
7.7
|
5.2
|
2.6
|
|
Aug-19
|
-8.6
|
-5.4
|
-3.9
|
2.6
|
2.9
|
3.8
|
-5.1
|
-0.9
|
-0.2
|
|
Sep-19
|
-20.5
|
-5.4
|
-4.9
|
-6.6
|
5.4
|
-1.4
|
-2.0
|
-2.6
|
-5.1
|
|
Oct-19
|
-17.6
|
-5.1
|
-5.6
|
0.4
|
11.8
|
-0.5
|
-7.7
|
-12.2
|
-5.5
|
|
Nov-19
|
-3.5
|
-6.0
|
-6.4
|
3.1
|
13.6
|
7.0
|
4.3
|
-4.9
|
0.7
|
|
Dec-19
|
6.1
|
-7.4
|
-9.2
|
3.0
|
10.2
|
8.7
|
5.5
|
0.0
|
3.1
|
|
Jan-20
|
8.0
|
-5.3
|
-9.0
|
1.9
|
-0.1
|
1.6
|
5.1
|
3.2
|
2.2
|
|
Feb-20
|
11.3
|
-6.4
|
-9.6
|
7.4
|
2.9
|
2.9
|
7.8
|
11.5
|
6.4
|
|
Mar-20
|
4.0
|
-5.5
|
-15.1
|
-0.5
|
-11.9
|
-21.9
|
-25.1
|
-8.2
|
-8.6
|
|
Apr-20
|
-15.5
|
-6.4
|
-19.9
|
-24.2
|
-4.5
|
-78.7
|
-85.3
|
-23.0
|
-37.0
|
|
May-20
|
-14.0
|
-7.1
|
-16.8
|
-21.3
|
7.5
|
-43.1
|
-21.4
|
-14.8
|
-22.0
|
|
Jun-20
|
-15.5
|
-6.0
|
-12.0
|
-8.9
|
4.2
|
-33.8
|
-6.9
|
-11.0
|
-15.0
|
*****
***
सोशल मिडियावर आम्हाला फॉलो करा @PIBMumbai
  /PIBMumbai
  /pibmumbai
  pibmumbai[at]gmail[dot]com
(रिलीज़ आईडी: 1642633)
आगंतुक पटल : 219