|
Ministry of Statistics & Programme Implementation
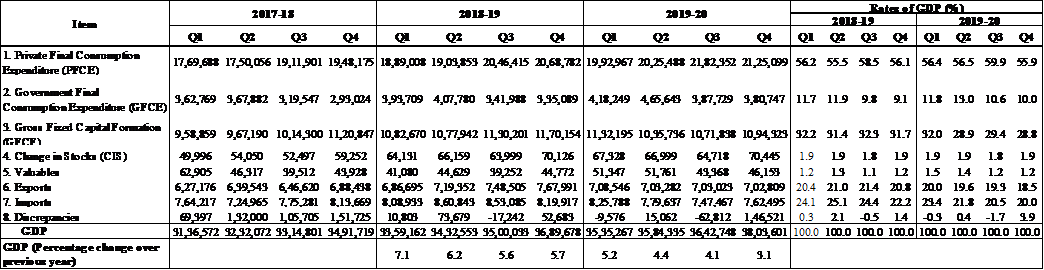
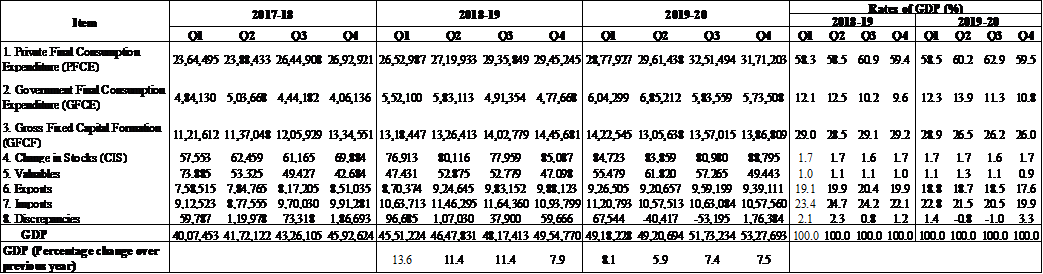
Provisional Estimates of Annual National Income, 2019-20 and Quarterly Estimates (q4) of Gross Domestic Product, 2019-20
प्रविष्टि तिथि:
29 MAY 2020 5:45PM by PIB Delhi
The National Statistical Office (NSO), Ministry of Statistics and Programme Implementation, has released the Provisional Estimates of National Income for the financial year 2019-20, both at Constant (2011-12) and Current Prices. These are presented in Statements 1 to 4.
2. Quarterly Estimates of Gross Domestic Product (GDP) for the fourth quarter (January-March) of 2019-20, both at Constant (2011-12) and Current Prices along with the corresponding quarterly estimates of expenditure components of GDP are also released. These are presented in Statements 5 to 8. Estimates including growth rates of Q1, Q2 and Q3 of 2019-20 released earlier have been revised in accordance with the revision policy of National Accounts.
3. In view of the global COVID-19 pandemic and consequent nationwide lockdown measures implemented since March, 2020; the data flow from the economic entities has been impacted. As some of these units are yet to resume operations and owing to the fact that the statutory time-lines for submitting the requisite financial returns have been extended by the Government, these Estimates are based on the available data. Consequently, the Estimates (Quarterly as well as Annual) are likely to undergo revision.
4. The Second Advance Estimates (SAE) of National Income for the year 2019-20 were released on 28th February, 2020. These estimates have now been revised incorporating latest estimates of Agricultural Production, Index of Industrial Production (IIP) and performance of key sectors like, Railways, Transport other than Railways, Communication, Banking, Insurance and Government Revenue Expenditure. With the introduction of Goods and Services Tax (GST) from 1st July 2017 and consequent changes in the tax structure, the total Tax Revenue used for GDP compilation includes Non-GST Revenue and GST Revenue. For obtaining Taxes on Products at Constant Prices, volume extrapolation is done using volume growth of taxed goods and services and aggregated to get the total volume of taxes. Early results on the performance of Corporate Sector for April-December 2019 which were used in SAE have been revised on the basis of latest available information. Besides information on indicators like Deposits & Credits, Passenger and Freight Earnings of Railways, Passenger Traffic and Cargo Handled at Airports, Cargo Handled at Major Sea Ports, Sales of Commercial Vehicles etc., available for first 9/10 months of the financial year used in the SAE have been revised with the updated data upto March, 2020.
5. Real GDP or Gross Domestic Product (GDP) at Constant (2011-12) Prices in the year 2019-20 is now estimated to attain a level of ₹ 145.66 lakh crore, as against the First Revised Estimate of GDP for the year 2018-19 of ₹ 139.81 lakh crore, released on 31st January 2020. The growth in GDP during 2019-20 is estimated at 4.2 percent as compared to 6.1 percent in 2018-19.
6. GDP at Current Prices in the year 2019-20 is estimated to attain a level of ₹ 203.40 lakh crore, as against the First Revised Estimates of ₹ 189.71 lakh crore in 2018-19, showing a growth rate of 7.2 percent as compared to 11.0 percent in 2018-19.
7. The Per Capita Income in real terms (at 2011-12 Prices) during 2019-20 is estimated to attain a level of ₹ 94,954 as compared to ₹ 92,085 in the year 2018-19, resulting in growth of 3.1 percent during 2019-20, as against 4.8 per cent in the previous year. The Per Capita Income at current prices during 2019-20 is estimated to be ₹ 134,226, showing a rise of 6.1 percent as compared to ₹ 1,26,521 during 2018-19.
8. GDP at Constant (2011-12) Prices in Q4 of 2019-20 is estimated at ₹ 38.04 lakh crore, as against ₹ 36.90 lakh crore in Q4 of 2018-19, showing a growth of 3.1 percent.
9. Changes in the main indicators used in the estimation are listed below:
|
Indicators
|
Annual
|
Quarterly
|
|
2018-19
|
2019-20
|
Q4 2018-19
|
Q4 2019-20
|
|
Production of Coal
|
7.4
|
-0.5
|
6.4
|
7.0
|
|
Production of Crude Oil
|
-4.2
|
-5.9
|
-5.5
|
-5.7
|
|
Production of Cement
|
13.3
|
-0.8
|
11.7
|
-4.9
|
|
Consumption of Steel
|
7.5
|
1.3
|
9.4
|
-3.9
|
|
Sales of Commercial Vehicles
|
17.6
|
-28.8
|
3.8
|
-42.1
|
|
Cargo Handled at Major Sea Ports
|
2.9
|
0.9
|
0.1
|
0.1
|
|
Cargo Handled at Airports
|
2.5
|
-9.0
|
-0.9
|
-13.6
|
|
Passengers Handled at Airports
|
11.8
|
-1.0
|
3.9
|
-9.5
|
|
Railways
|
|
|
(i) Net Tonne Kilometers
|
6.6
|
-4.5
|
5.8
|
-6.7
|
|
(ii) Passenger Kilometers
|
1.7
|
-4.3
|
1.0
|
-14.2
|
|
Aggregate Bank Deposits
|
10.0
|
7.9
|
67.1
|
-53.0
|
|
Aggregate Bank Credits
|
13.3
|
6.1
|
-1.7
|
-20.0
|
|
LIC Premium - Non-Linked
|
6.1
|
11.4
|
18.2
|
-11.6
|
|
LIC Premium - Linked
|
-8.4
|
-10.5
|
-7.5
|
-19.3
|
|
CPI General Index
|
3.4
|
4.8
|
2.5
|
6.7
|
|
IIP
|
|
|
(i) Mining
|
2.8
|
1.7
|
2.2
|
4.5
|
|
(ii) Manufacturing
|
3.8
|
-1.1
|
1.4
|
-5.7
|
|
(iii) Electricity
|
5.2
|
0.8
|
1.5
|
1.1
|
|
(iv) Metallic Minerals
|
2.4
|
14.3
|
2.2
|
12.9
|
|
Indicators
|
Annual
|
Quarterly
|
|
2018-19
|
2019-20
|
Q4 2018-19
|
Q4 2019-20
|
|
WPI
|
|
|
(i) Food Articles
|
0.4
|
8.4
|
3.9
|
8.0
|
|
(ii) Minerals
|
11.4
|
12.5
|
10.5
|
8.7
|
|
(iii) Manufactured Products
|
3.7
|
0.3
|
2.4
|
0.5
|
|
(iv) All Commodities
|
4.3
|
1.7
|
2.9
|
2.3
|
10. Estimates of Gross/Net National Income and Per Capita Income along with GVA at Basic Prices by kind of economic activity, Expenditures on GDP for Provisional Estimates and the four quarters of 2017-18, 2018-19 and 2019-20 at Constant (2011-12) and Current Prices, along with percent changes and the rates of expenditure components of GDP, are given in Statements 1 to 8.
11. The next release of quarterly GDP estimates for the quarter April-June, 2020 (Q1 of 2020-21) will be on 31.08.2020.
|
STATEMENT 1: Provisional Estimates of National Income and Expenditures on GDP, 2019-20 (at 2011- 12 Prices)
|
|
(` crore)
|
|
S. No.
|
Item
|
2017-18
(2nd RE)
|
2018-19
(1st RE)
|
2019-20
(PE)
|
Percentage Change Over Previous Year
|
|
2018-19
|
2019-20
|
|
|
Domestic Product
|
|
|
|
|
|
1
|
GVA at Basic Prices
|
1,20,74,413
|
1,28,03,128
|
1,33,01,120
|
6.0
|
3.9
|
|
2
|
Net Taxes on Products
|
11,00,747
|
11,78,298
|
12,64,831
|
7.0
|
7.3
|
|
3
|
GDP (1+2)
|
1,31,75,160
|
1,39,81,426
|
1,45,65,951
|
6.1
|
4.2
|
|
4
|
NDP
|
1,16,86,409
|
1,23,72,051
|
1,28,93,977
|
5.9
|
4.2
|
|
|
Final Expenditures
|
|
|
|
|
|
5
|
PFCE
|
73,79,819
|
79,08,057
|
83,25,907
|
7.2
|
5.3
|
|
6
|
GFCE
|
13,43,222
|
14,78,565
|
16,52,367
|
10.1
|
11.8
|
|
7
|
GFCF
|
40,61,195
|
44,60,967
|
43,34,091
|
9.8
|
-2.8
|
|
8
|
CIS
|
2,15,795
|
2,64,415
|
2,69,489
|
22.5
|
1.9
|
|
9
|
Valuables
|
1,92,661
|
1,69,734
|
1,92,629
|
-11.9
|
13.5
|
|
10
|
Exports of Goods and Services
|
26,01,777
|
29,22,543
|
28,17,660
|
12.3
|
-3.6
|
|
11
|
Imports of Goods and Services
|
30,78,132
|
33,42,777
|
31,15,388
|
8.6
|
-6.8
|
|
12
|
Discrepancies
|
4,58,823
|
1,19,923
|
89,196
|
|
|
|
13
|
GDP
|
1,31,75,160
|
1,39,81,426
|
1,45,65,951
|
6.1
|
4.2
|
|
|
Rates to GDP
|
|
|
|
|
|
|
14
|
PFCE
|
56.0
|
56.6
|
57.2
|
|
|
|
15
|
GFCE
|
10.2
|
10.6
|
11.3
|
|
|
|
16
|
GFCF
|
30.8
|
31.9
|
29.8
|
|
|
|
17
|
CIS
|
1.6
|
1.9
|
1.9
|
|
|
|
18
|
Valuables
|
1.5
|
1.2
|
1.3
|
|
|
|
19
|
Exports of Goods and Services
|
19.7
|
20.9
|
19.3
|
|
|
|
20
|
Imports of Goods and Services
|
23.4
|
23.9
|
21.4
|
|
|
|
21
|
Discrepancies
|
3.5
|
0.9
|
0.6
|
|
|
|
22
|
GDP
|
100.0
|
100.0
|
100.0
|
|
|
|
|
National Product
|
|
|
|
|
|
|
23
|
GNI
|
1,30,29,307
|
1,38,29,068
|
1,44,05,339
|
6.1
|
4.2
|
|
24
|
NNI
|
1,15,40,556
|
1,22,19,693
|
1,27,33,366
|
5.9
|
4.2
|
|
Per Capita Income, Product and Final Consumption
|
|
25
|
Population* (in million)
|
1314
|
1327
|
1341
|
1.0
|
1.1
|
|
26
|
Per Capita GDP (₹)
|
1,00,268
|
1,05,361
|
1,08,620
|
5.1
|
3.1
|
|
27
|
Per Capita GNI (₹)
|
99,158
|
1,04,213
|
1,07,422
|
5.1
|
3.1
|
|
28
|
Per Capita NNI (₹)
|
87,828
|
92,085
|
94,954
|
4.8
|
3.1
|
|
29
|
Per Capita PFCE (₹)
|
56,163
|
59,594
|
62,087
|
6.1
|
4.2
|
| |
|
|
|
|
|
|
|
|
|
*Relates to mid-financial year
RE: Revised Estimates
PE: Provisional Estimates
|
STATEMENT 2: Provisional Estimates of National Income and Expenditures on GDP, 2019-20 (at Current Prices)
(` crore)
|
|
S. No.
|
Item
|
2017-18
(2nd RE)
|
2018-19
(1st RE)
|
2019-20
(PE)
|
Percentage Change Over Previous Year
|
|
|
|
|
2018-19
|
2019-20
|
|
|
|
Domestic Product
|
|
|
|
|
|
|
1
|
GVA at Basic Prices
|
1,55,13,122
|
1,71,39,962
|
1,83,43,237
|
10.5
|
7.0
|
|
|
2
|
Net taxes on products
|
15,85,182
|
18,31,275
|
19,96,612
|
15.5
|
9.0
|
|
|
3
|
GDP (1+2)
|
1,70,98,304
|
1,89,71,237
|
2,03,39,849
|
11.0
|
7.2
|
|
|
4
|
NDP
|
1,53,34,357
|
1,69,91,613
|
1,82,21,249
|
10.8
|
7.2
|
|
|
|
Final Expenditures
|
|
|
|
|
|
|
5
|
PFCE
|
1,00,90,759
|
1,12,54,014
|
1,22,62,064
|
11.5
|
9.0
|
|
|
6
|
GFCE
|
18,38,117
|
21,04,235
|
24,46,579
|
14.5
|
16.3
|
|
|
7
|
GFCF
|
47,99,139
|
54,93,320
|
54,72,006
|
14.5
|
-0.4
|
|
|
8
|
CIS
|
2,51,062
|
3,20,076
|
3,38,357
|
27.5
|
5.7
|
|
|
9
|
Valuables
|
2,19,322
|
2,00,184
|
2,24,006
|
-8.7
|
11.9
|
|
|
10
|
Exports of Goods and Services
|
32,11,521
|
37,66,294
|
37,45,473
|
17.3
|
-0.6
|
|
|
11
|
Imports of Goods and Services
|
37,51,389
|
44,68,166
|
42,98,950
|
19.1
|
-3.8
|
|
|
12
|
Discrepancies
|
4,39,775
|
3,01,280
|
1,50,314
|
|
|
|
|
13
|
GDP
|
1,70,98,304
|
1,89,71,237
|
2,03,39,849
|
11.0
|
7.2
|
|
|
|
Rates to GDP
|
|
|
|
|
|
|
14
|
PFCE
|
59.0
|
59.3
|
60.3
|
|
|
|
|
15
|
GFCE
|
10.8
|
11.1
|
12.0
|
|
|
|
|
16
|
GFCF
|
28.1
|
29.0
|
26.9
|
|
|
|
|
17
|
CIS
|
1.5
|
1.7
|
1.7
|
|
|
|
|
18
|
Valuables
|
1.3
|
1.1
|
1.1
|
|
|
|
|
19
|
Exports of Goods and Services
|
18.8
|
19.9
|
18.4
|
|
|
|
|
20
|
Imports of Goods and Services
|
21.9
|
23.6
|
21.1
|
|
|
|
|
21
|
Discrepancies
|
2.6
|
1.6
|
0.7
|
|
|
|
|
22
|
GDP
|
100.0
|
100.0
|
100.0
|
|
|
|
|
|
National Product
|
|
|
|
|
|
|
|
23
|
GNI
|
1,69,13,491
|
1,87,68,912
|
2,01,18,353
|
11.0
|
7.2
|
|
|
24
|
NNI
|
1,51,49,545
|
1,67,89,288
|
1,79,99,754
|
10.8
|
7.2
|
|
|
25
|
GNDI
|
1,73,19,231
|
1,92,62,652
|
2,06,30,319
|
11.2
|
7.1
|
|
|
26
|
NNDI
|
1,55,55,285
|
1,72,83,028
|
1,85,11,719
|
11.1
|
7.1
|
|
|
Per Capita Income, Product and Final Consumption
|
|
|
27
|
Per Capita GDP (₹)
|
1,30,124
|
1,42,963
|
1,51,677
|
9.9
|
6.1
|
|
|
28
|
Per Capita GNI (₹)
|
1,28,718
|
1,41,439
|
1,50,025
|
9.9
|
6.1
|
|
|
29
|
Per Capita NNI (₹)
|
1,15,293
|
1,26,521
|
1,34,226
|
9.7
|
6.1
|
|
|
30
|
Per Capita GNDI (₹)
|
1,31,805
|
1,45,159
|
1,53,843
|
10.1
|
6.0
|
|
|
31
|
Per Capita PFCE (₹)
|
76,794
|
84,808
|
91,440
|
10.4
|
7.8
|
|
|
|
|
|
|
|
|
|
|
|
Note: Estimates of Disposable Income are compiled only at current prices.
|
|
|
STATEMENT 3: Provisional Estimates of GVA at Basic Price by Economic Activity (at 2011-12 prices)
|
|
(` crore)
|
|
Industry
|
2017-18
(2nd RE)
|
2018-19
(1st RE)
|
2019-20
(PE)
|
Percentage Change Over Previous Year
|
|
2018-19
|
2019-20
|
|
1. Agriculture, Forestry & Fishing
|
18,28,329
|
18,72,339
|
19,48,110
|
2.4
|
4.0
|
|
2. Mining & Quarrying
|
3,66,496
|
3,45,069
|
3,55,680
|
-5.8
|
3.1
|
|
3. Manufacturing
|
21,90,791
|
23,16,643
|
23,17,280
|
5.7
|
0.03
|
|
4. Electricity, Gas, Water Supply & other Utility Services
|
2,74,104
|
2,96,560
|
3,08,832
|
8.2
|
4.1
|
|
5. Construction
|
9,62,009
|
10,20,314
|
10,33,276
|
6.1
|
1.3
|
|
6. Trade, Hotels, Transport, Communication and Services related to Broadcasting
|
23,09,860
|
24,88,049
|
25,77,945
|
7.7
|
3.6
|
|
7. Financial, Real Estate & Professional Services
|
26,09,016
|
27,86,855
|
29,15,680
|
6.8
|
4.6
|
|
8. Public Administration, Defence and Other Services
|
15,33,809
|
16,77,298
|
18,44,316
|
9.4
|
10.0
|
|
GVA at Basic Prices
|
1,20,74,413
|
1,28,03,128
|
1,33,01,120
|
6.0
|
3.9
|
|
STATEMENT 4: Provisional Estimates of GVA at Basic Price by Economic Activity (at Current Prices)
|
|
(` crore)
|
|
Industry
|
2017-18
(2nd RE)
|
2018-19
(1st RE)
|
2019-20
(PE)
|
Percentage Change Over Previous Year
|
|
2018-19
|
2019-20
|
|
1. Agriculture, Forestry & Fishing
|
27,96,908
|
29,22,846
|
32,57,443
|
4.5
|
11.4
|
|
2. Mining & Quarrying
|
3,57,788
|
3,89,322
|
3,93,102
|
8.8
|
1.0
|
|
3. Manufacturing
|
25,46,608
|
27,66,767
|
27,75,587
|
8.6
|
0.3
|
|
4. Electricity, Gas, Water Supply & other Utility Services
|
4,25,101
|
4,56,413
|
4,86,516
|
7.4
|
6.6
|
|
5. Construction
|
11,97,931
|
13,44,279
|
13,84,895
|
12.2
|
3.0
|
|
6. Trade, Hotels, Transport, Communication and Services related to Broadcasting
|
28,12,706
|
31,42,620
|
33,16,653
|
11.7
|
5.5
|
|
7. Financial, Real Estate & Professional Services
|
32,06,559
|
36,22,130
|
38,42,524
|
13.0
|
6.1
|
|
8. Public Administration, Defence and Other Services
|
21,69,522
|
24,95,584
|
28,86,517
|
15.0
|
15.7
|
|
GVA at Basic Prices
|
1,55,13,122
|
1,71,39,962
|
1,83,43,237
|
10.5
|
7.0
|
|
STATEMENT 5: Quarterly Estimates of GVA at Basic Prices for 2019-20 (at 2011-12 prices)
(` crore)
|
|
Industry
|
2017-18
|
2018-19
|
2019-20
|
Percentage Change Over Previous Year
|
|
2018-19
|
2019-20
|
|
Q1
|
Q2
|
Q3
|
Q4
|
Q1
|
Q2
|
Q3
|
Q4
|
Q1
|
Q2
|
Q3
|
Q4
|
Q1
|
Q2
|
Q3
|
Q4
|
Q1
|
Q2
|
Q3
|
Q4
|
|
1. Agriculture, Forestry & Fishing
|
4,11,366
|
3,46,486
|
5,77,270
|
4,93,208
|
4,27,177
|
3,55,283
|
5,88,679
|
5,01,199
|
4,39,843
|
3,67,758
|
6,09,883
|
5,30,626
|
3.8
|
2.5
|
2.0
|
1.6
|
3.0
|
3.5
|
3.6
|
5.9
|
|
2. Mining & Quarrying
|
95,649
|
75,002
|
86,635
|
1,09,209
|
88,634
|
69,723
|
82,797
|
1,03,915
|
92,807
|
68,978
|
84,610
|
1,09,285
|
-7.3
|
-7.0
|
-4.4
|
-4.8
|
4.7
|
-1.1
|
2.2
|
5.2
|
|
3. Manufacturing
|
5,07,569
|
5,48,729
|
5,32,956
|
6,01,537
|
5,61,875
|
5,79,649
|
5,60,719
|
6,14,400
|
5,78,936
|
5,76,112
|
5,56,494
|
6,05,738
|
10.7
|
5.6
|
5.2
|
2.1
|
3.0
|
-0.6
|
-0.8
|
-1.4
|
|
4. Electricity, Gas, Water Supply & other Utility Services
|
69,504
|
69,698
|
66,968
|
67,935
|
74,998
|
76,567
|
73,338
|
71,655
|
81,628
|
79,525
|
72,817
|
74,863
|
7.9
|
9.9
|
9.5
|
5.5
|
8.8
|
3.9
|
-0.7
|
4.5
|
|
5. Construction
|
2,34,844
|
2,26,098
|
2,43,408
|
2,57,660
|
2,49,913
|
2,37,907
|
2,59,449
|
2,73,046
|
2,62,828
|
2,44,092
|
2,59,357
|
2,67,000
|
6.4
|
5.2
|
6.6
|
6.0
|
5.2
|
2.6
|
-0.04
|
-2.2
|
|
6. Trade, Hotels, Transport, Communication and Services related to Broadcasting
|
5,61,803
|
5,44,822
|
5,65,597
|
6,37,636
|
6,09,330
|
5,87,337
|
6,09,595
|
6,81,786
|
6,30,860
|
6,11,609
|
6,35,724
|
6,99,751
|
8.5
|
7.8
|
7.8
|
6.9
|
3.5
|
4.1
|
4.3
|
2.6
|
|
7. Financial, Real Estate & Professional Services
|
7,15,262
|
7,66,707
|
5,62,903
|
5,64,147
|
7,57,850
|
8,16,260
|
5,99,505
|
6,13,241
|
8,03,322
|
8,64,974
|
6,19,229
|
6,28,155
|
6.0
|
6.5
|
6.5
|
8.7
|
6.0
|
6.0
|
3.3
|
2.4
|
|
8. Public Administration, Defence and Other Services
|
3,56,199
|
3,85,050
|
4,00,441
|
3,92,120
|
3,87,589
|
4,19,300
|
4,32,842
|
4,37,564
|
4,17,483
|
4,65,096
|
4,80,107
|
4,81,630
|
8.8
|
8.9
|
8.1
|
11.6
|
7.7
|
10.9
|
10.9
|
10.1
|
|
GVA at Basic Prices
|
29,52,197
|
29,62,592
|
30,36,177
|
31,23,451
|
31,57,366
|
31,42,027
|
32,06,925
|
32,96,807
|
33,07,707
|
32,78,144
|
33,18,220
|
33,97,049
|
6.9
|
6.1
|
5.6
|
5.6
|
4.8
|
4.3
|
3.5
|
3.0
|
|
STATEMENT 6: Quarterly Estimates of GVA at Basic Prices for 2019-20 (at Current Prices)
(` crore)
|
|
Industry
|
2017-18
|
2018-19
|
2019-20
|
Percentage Change Over Previous Year
|
|
2018-19
|
2019-20
|
|
Q1
|
Q2
|
Q3
|
Q4
|
Q1
|
Q2
|
Q3
|
Q4
|
Q1
|
Q2
|
Q3
|
Q4
|
Q1
|
Q2
|
Q3
|
Q4
|
Q1
|
Q2
|
Q3
|
Q4
|
|
1. Agriculture, Forestry & Fishing
|
6,14,682
|
5,44,703
|
9,03,485
|
7,34,038
|
6,55,799
|
5,60,416
|
9,24,273
|
7,82,358
|
7,12,222
|
6,08,227
|
10,53,034
|
8,83,959
|
6.7
|
2.9
|
2.3
|
6.6
|
8.6
|
8.5
|
13.9
|
13.0
|
|
2. Mining & Quarrying
|
89,447
|
69,310
|
86,182
|
1,12,849
|
98,202
|
80,476
|
97,355
|
1,13,290
|
1,04,945
|
75,826
|
92,789
|
1,19,543
|
9.8
|
16.1
|
13.0
|
0.4
|
6.9
|
-5.8
|
-4.7
|
5.5
|
|
3. Manufacturing
|
5,83,784
|
6,33,546
|
6,20,420
|
7,08,858
|
6,64,844
|
6,92,530
|
6,73,890
|
7,35,502
|
6,94,993
|
6,87,906
|
6,64,294
|
7,28,394
|
13.9
|
9.3
|
8.6
|
3.8
|
4.5
|
-0.7
|
-1.4
|
-1.0
|
|
4. Electricity, Gas, Water Supply & other Utility Services
|
1,06,824
|
1,07,304
|
1,03,950
|
1,07,023
|
1,13,836
|
1,18,456
|
1,13,804
|
1,10,316
|
1,24,751
|
1,22,547
|
1,15,188
|
1,24,030
|
6.6
|
10.4
|
9.5
|
3.1
|
9.6
|
3.5
|
1.2
|
12.4
|
|
5. Construction
|
2,87,451
|
2,80,664
|
3,05,759
|
3,24,057
|
3,24,955
|
3,14,756
|
3,45,528
|
3,59,041
|
3,50,920
|
3,25,815
|
3,49,232
|
3,58,928
|
13.0
|
12.1
|
13.0
|
10.8
|
8.0
|
3.5
|
1.1
|
-0.03
|
|
6. Trade, Hotels, Transport, Communication and Services related to Broadcasting
|
6,72,181
|
6,61,102
|
6,94,315
|
7,85,108
|
7,58,987
|
7,44,890
|
7,78,223
|
8,60,520
|
8,06,915
|
7,83,108
|
8,21,438
|
9,05,193
|
12.9
|
12.7
|
12.1
|
9.6
|
6.3
|
5.1
|
5.6
|
5.2
|
|
7. Financial, Real Estate & Professional Services
|
8,67,582
|
9,44,159
|
6,96,275
|
6,98,542
|
9,74,229
|
10,68,600
|
7,85,893
|
7,93,409
|
10,56,866
|
11,38,695
|
8,18,382
|
8,28,581
|
12.3
|
13.2
|
12.9
|
13.6
|
8.5
|
6.6
|
4.1
|
4.4
|
|
8. Public Administration, Defence and Other Services
|
4,92,027
|
5,44,308
|
5,73,664
|
5,59,522
|
5,65,871
|
6,23,661
|
6,49,806
|
6,56,245
|
6,37,682
|
7,23,713
|
7,60,995
|
7,64,128
|
15.0
|
14.6
|
13.3
|
17.3
|
12.7
|
16.0
|
17.1
|
16.4
|
|
GVA at Basic Prices
|
37,13,978
|
37,85,096
|
39,84,050
|
40,29,998
|
41,56,723
|
42,03,786
|
43,68,772
|
44,10,682
|
44,89,292
|
44,65,838
|
46,75,351
|
47,12,757
|
11.9
|
11.1
|
9.7
|
9.4
|
8.0
|
6.2
|
7.0
|
6.8
|
| |
|
|
|
|
|
|
|
|
|
|
|
|
|
|
|
|
|
|
|
|
|
|
|
|
|
|
|
|
|
|
|
|
|
|
|
|
STATEMENT 7: Quarterly Estimates of Expenditures on GDP for 2019-20 (at 2011-12 prices)
STATEMENT 8: Quarterly Estimates of Expenditures on GDP for 2019-20 (at Current Prices)
(₹ crore)
*******
VRRK/VJ
(रिलीज़ आईडी: 1627671)
|