Ministry of Statistics & Programme Implementation
Annual Survey of Unincorporated Sector Enterprises (ASUSE) Results for 2021-22 and 2022-23
The estimated number of establishments grew by 5.88% during the period October, 2022 – September, 2023 in comparison to April, 2021 – March, 2022
The estimated number of workers in the sector has shown robust growth of 7.84% during this period
Gross value Added (GVA) also grew by 9.83% (at current price) during this period
प्रविष्टि तिथि:
14 JUN 2024 5:49PM by PIB Delhi
The Ministry of Statistics and Programme Implementation (MoSPI) is releasing the key results of the Annual Survey of Unincorporated Sector Enterprises (ASUSE) for the reference periods of April 2021 to March 2022 (ASUSE 2021-22) and October 2022 to September 2023 (ASUSE 2022-23). A brief overview of the survey in terms of coverage, sampling strategy, data collection mechanism, etc., is provided in the Endnote.
The unincorporated non-agricultural sector plays a pivotal role in the Indian economy contributing significantly to employment, Gross Domestic Product and the overall socio-economic landscape. The sector also supports the incorporated sector by acting as suppliers and service providers, thereby forming an integral part of the domestic value chain.
In order to realistically capture the economic and operational dynamics of this sector, ASUSE was conceptualized by the National Sample Survey Office (NSSO) for exclusively measuring various economic and operational characteristics of unincorporated non-agricultural establishments in manufacturing, trade and other services sectors (excluding construction). Data from ASUSE will help in the compilation of National Accounts Statistics and also to gauge the demand-side employment scenario in the sector. It will also help in meeting the requirements of different Ministries, such as the Ministry of Micro, Small and Medium Enterprises (MSME), Ministry of Textile, Ministry of Labour and Employment, etc. Additionally, this data is essential for policymakers, researchers and other stakeholders to better understand and support this crucial segment of the economy.
Effect of Covid Pandemic on the first full-fledged survey of ASUSE (ASUSE 2021-22):
The survey period of ASUSE 2021-22, particularly the period April – June, 2021, has been severely impacted by the second wave of the pandemic and, in turn, the survey got hampered to a great extent. As a result, the overall annual aggregate estimates of ASUSE 2021-22 were affected. In this context, Table 1 below separately gives the contribution of different survey periods (canvassing period), i.e., April - June 2021, July - September 2021, October - December 2021 and January - March 2022 to the total estimated number of establishments and workers.
Table 1 shows that the first quarter of the survey, i.e., April - June 2021 has suffered the most due to the pandemic and reported a very less number of establishments and workers. The overall annual estimates also got affected to a great extent due to this. It appears that the unincorporated manufacturing, trade and other service activities were hit by the second wave of the pandemic badly; however, the situation improved gradually from July 2021 onwards.
|
Table1: Contribution of survey periods to the estimated number of establishments and workers in ASUSE 2021-22*
all-India
|
|
Survey period
|
Estimated number of establishments (in ’00)
|
Estimated number of workers (in ’00)
|
|
(1)
|
(2)
|
(3)
|
|
April -June, 2021
|
50,323
|
85,620
|
|
July - September, 2021
|
1,73,904
|
2,84,152
|
|
October - December, 2021
|
1,80,957
|
2,96,348
|
|
January - March, 2022
|
1,91,843
|
3,12,759
|
|
Total
|
5,97,027
|
9,78,879
|
* Reference period: April, 2021 – March, 2022
Key highlights from ASUSE 2021-22 and ASUSE 2022-23 results
Resilient Growth of Unincorporated Sector:
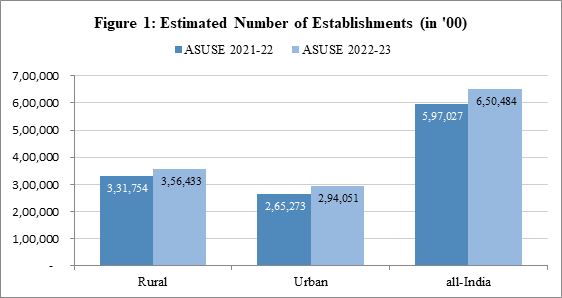
The results exhibit the resilience shown by the unincorporated sector after the COVID pandemic shock. The total number of establishments in the sector increased from 5.97 crore in 2021-22 to 6.50 crore in 2022-23, representing a 5.88% annual growth[1].
Among the broad sectors under coverage, the number of establishments in the other services sector grew annually by 15.12%, indicating a robust sectoral expansion, while the number of manufacturing establishments increased by 2.22% reflecting a gradual opening up of the sector after the pandemic period.
During the same period, the Gross Value Added (GVA)[2] which is a key indicator of economic performance witnessed an annual growth of 9.83%. The major contributors to this GVA growth may be attributed to manufacturing and other service sectors. While the manufacturing GVA increased by 19.14% annually, for other services, GVA grew by 18.90%.
Expanding Labour Market and Employment opportunities
The unincorporated non-agricultural sector employed about 11 crore workers from October 2022 to September 2023, up from 9.8 crore in 2021-22, showing a healthy labour market growth. This 7.84% annual growth demonstrates the sector’s capacity to generate employment.
Sector-wise, the estimated number of establishments and workers from these two years are shown in Figure 1 and Figure 2 respectively.
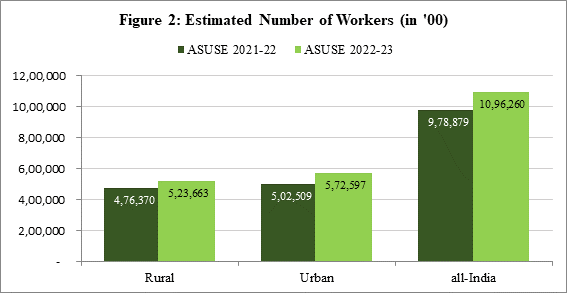
The maximum annual growth in employment during the period was observed in other services sector (13. 42%) followed by the manufacturing sector (6.34%).
Majority of the workers in the non-agricultural unincorporated sector are informal workers. The survey shows that the average annual earnings for informal workers rose to Rs. 1,10,982 in 2022-23 from Rs. 1,06,381 in 2021-22. This reflects an improved wage conditions in the informal sector.
Improved Productivity
Gross Value Added (GVA) per worker which is a measure of labour productivity of the sector, rose to Rs. 1,41,769 in 2022-23 from Rs. 1,38,207 in 2021-22. During the same period, the Gross Value of Output (GVO) per establishment also increased from Rs. 3,98,304 to Rs. 4,63,389.
This indicates an increased productivity with more efficient use of resources including labour, which is critical for sustained economic growth and competitiveness.
Annual estimates of key indicators (value figures in current price), of ASUSE 2022-23 and ASUSE 2021-22 are given in Table 2 below. Further, the estimates for ASUSE 2021-22 are presented annually (April, 2021 – March, 2022), and for the 3 months (April, 2021 – June, 2021) and 9-month period (July, 2021 – March, 2022) separately and the same along-with annual estimates of ASUSE 2022-23 (October, 2022 – September, 2023) are provided in the factsheet which is available in the website of the Ministry (https://www.mospi.gov.in).
|
Table 2: Key indicators of ASUSE 2021-22 and ASUSE 2022-23
|
|
all-India
|
|
Indicator
|
ASUSE 2021-22
(April, 2021 – March,2022)
|
ASUSE 2022-23
(October,2022 – September, 2023)
|
|
(1)
|
(2)
|
(3)
|
|
Number of Establishments (in ’00)
|
5,97,027
|
6,50,484
|
|
Number of Workers (in ’00)
|
9,78,879
|
10,96,260
|
|
Gross Value Added (Rs. Crore)*
|
13,40,046
|
15,42,409
|
|
Gross Value of Output (GVO)* (Rs.) per Establishment
|
3,98,304
|
4,63,389
|
|
GVA (Rs.) per establishment*(Rs.)
|
2,25,362
|
2,38,168
|
|
GVA per worker* (Rs.)
|
1,38,207
|
1,41,769
|
*pertaining to market establishments[3]
A brief about the coverage, sampling scheme, sample size and data collection mechanism in the Annual Survey of Unincorporated Sector Enterprises (ASUSE):
A. Coverage of ASUSE:
A.1. Geographically, ASUSE covers the rural and urban areas of whole of India (except the villages in Andaman and Nicobar Islands, which are difficult to access).
A.2. Sector-wise, this survey captures unincorporated non-agricultural establishments belonging to three sectors viz., Manufacturing, Trade and Other Services.
A.3. Ownership-wise, unincorporated non-agricultural establishments pertaining to proprietorship, partnership (excluding Limited Liability Partnerships), Self-Help Groups (SHG), co-operatives, societies/trusts etc. have been covered in ASUSE.
B. Sampling Scheme:
The survey has been conducted following a multi-stage stratified sampling scheme, where first stage units (FSUs) are census villages in rural (except for rural Kerala, where Panchayat wards have been taken as FSUs) and UFS (Urban Frame Survey) blocks in urban areas. The ultimate stage units (USUs) are establishments for both sectors. In the case of large FSUs, one intermediate stage of sampling has been done in the form of hamlet groups in rural and sub-blocks in urban.
C. Sample Size:
In ASUSE 2021-22, data were collected from a total of 4,16,269 establishments (2,39,981 in rural and 1,76,288 in urban) from 16,199 surveyed FSUs (8,425 in rural and 7,774 in urban) whereas in ASUSE 2022-23, 4,58,938 establishments (2,58,296 in rural and 2,00,642 in urban) were surveyed from 16,382 FSUs (8,495 in rural and 7,887 in urban).
D. Data Collection Mechanism:
Both ASUSE 2021-22 and ASUSE 2022-23 have been conducted based on area frame and establishments have been listed in the selected FSUs of both rural and urban sector. Mostly, data were collected from the selected establishments through oral enquiry pertaining to the ‘monthly’ reference period barring a few big establishments, which had provided annual data from their audited Books of Accounts. ASUSE 2021-22, the first full-fledged survey on ASUSE, has been conducted in Pen-and-Paper Personal Interview (PAPI) mode; whereas ASUSE 2022-23 has been conducted in Computer Assisted Personal Interview (CAPI) mode.
****
MG/MS
(रिलीज़ आईडी: 2025340)
आगंतुक पटल : 7134