Ministry of Communications
TRAI releases “Indian Telecom Services Performance Indicator Report” for the Quarter April-June, 2022
Posted On:
23 NOV 2022 8:12PM by PIB Delhi
The Telecom Regulatory Authority of India (TRAI) has released the “Indian Telecom Services Performance Indicator Report” for the Quarter ending 30th June, 2022, here today. This Report provides a broad perspective of the Telecom Services in India and presents the key parameters and growth trends of the Telecom Services as well as Cable TV, DTH & Radio Broadcasting services in India for the period covering 1st April, 2022 to 30th June, 2022 compiled mainly on the basis of information furnished by the Service Providers.
Executive Summary of the Report is enclosed. The complete Report is available on TRAI’s website (www.trai.gov.in and under the link http://www. trai.gov.in/release-publication/reports/performance-indicators-reports). Any suggestion or any clarification pertaining to this report, Shri Amit Sharma, Advisor (F&EA), TRAI may be contacted on Tel. +91-11-23234367 and e-mail: advfea2@trai.gov.in
The Indian Telecom Services Performance Indicators
April–June, 2022
Executive Summary
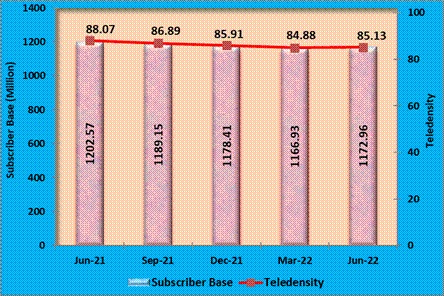
The number of telephone subscribers in India increased from 1,166.93 million at the end of Mar-22 to 1,172.96 million at the end of Jun-22, registering a growth rate of 0.52% over the previous quarter. This reflects Year-On-Year (Y-O-Y) decline rate of 2.46% over the same quarter of the last year. The overall Tele-density in India increased from 84.88% as in QE Mar-22 to 85.13% as in QE Jun-22.
Trends in Telephone subscribers and Tele-density in India
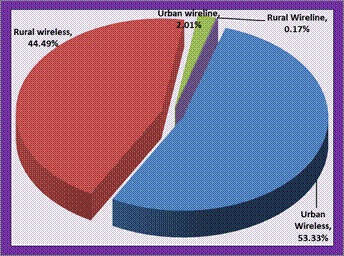
Telephone subscribers in Urban areas increased from 647.11 million at the end of Mar-22 to 649.09 million at the end of Jun-22 however Urban Tele-density decreased from 134.94% to 134.72% during the same period.
Rural telephone subscribers increased from 519.82 million at the end of Mar-22 to 523.27 million at the end of Jun-22 and Rural Tele-density also increased from 58.07% to 58.46% during the same period.
Out of the total subscription, the share of Rural subscription increased from 44.55% at the end of Mar-22 to 44.66% at the end of Jun-22.
Composition of Telephone Subscribers
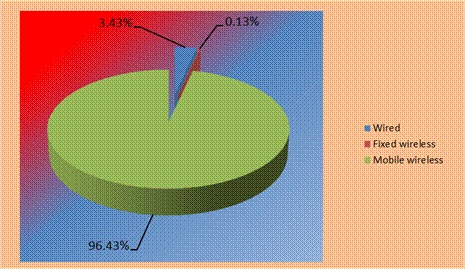
With a net increase of 5.30 million subscribers during the quarter, the total wireless subscriber base increased from 1,142.09 million at the end of Mar-22 to 1,147.39 million at the end of Jun-22, registering a growth rate of 0.46% over the previous quarter. On Y-O-Y basis, wireless subscriptions decreased at the rate of 2.83% during the year.
Wireless Tele-density increased from 83.07% at the end of Mar-22 to 83.27% at the end of Jun-22 with quarterly growth rate of 0.24%.
Wireline subscribers increased from 24.84 million at the end of Mar-22 to 25.57 million at the end of Jun-22 with a quarterly growth rate of 2.92% and, on Y-O-Y basis, wireline subscriptions also increased by 17.62% at the end of QE Jun-22.
Wireline Tele-density increased from 1.81% at the end of Mar-22 to 1.86% at the end of Jun-22 with quarterly growth rate of 2.69%.
Total number of Internet subscribers increased from 824.89 million at the end of Mar-22 to 836.86 million at the end of Jun-22, registering a quarterly growth rate of 1.45%. Out of 836.86 million internet subscribers, number of Wired Internet subscribers are 28.73 million and number of Wireless Internet subscribers are 808.13 million.
Composition of internet subscription
The Internet subscriber base is comprised of Broadband Internet subscriber base of 800.94 million and Narrowband Internet subscriber base of 35.92 million.
The broadband Internet subscriber base increased by 1.60% from 788.30 million at the end of Mar-22 to 800.94 million at the end of Jun-22. The narrowband Internet subscriber base declined by 1.84% from 36.59 million at the end of Mar-22 to 35.92 million at the end of Jun-22.
Monthly Average Revenue per User (ARPU) for wireless service increased by 5.02%, from Rs.127.17 in QE Mar-22 to Rs.133.55 in QE Jun-22. On Y-O-Y basis, monthly ARPU for wireless service increased by 27.61% in this quarter.
Prepaid ARPU per month increased from Rs.121.91 in QE Mar-22 to Rs.128.61 in QE Jun-22, however, Postpaid ARPU per month decreased from Rs.200.56 in QE Mar-22 to Rs.197.55 in QE Jun-22.
On an all-India average, the overall MOU per subscriber per month decreased by 4.38% from 955 in Q.E. March - 2022 to 914 in Q.E. June- 2022.
Prepaid MOU per subscriber per month decreased from 972 in QE Mar-22 to 936 in QE Jun-22. Postpaid MOU per subscriber per month also decreased from 721 in QE Mar-22 to 621 in QE Jun-22.
Gross Revenue (GR) and Adjusted Gross Revenue (AGR) of Telecom Service Sector for the Q.E. June-22 has been Rs.76,408/- Crore and Rs.60,530/- Crore respectively. GR decreased by 0.01% and AGR increased by 2.79% in Q.E. Jun-22, as compared to previous quarter.
The Y-O-Y growth in GR and AGR in Q.E. Jun-22 over the same quarter in last year has been 17.91% and 17.91% respectively.
Pass-through charges decreased from Rs.13,568 Crore in QE Mar-22 to Rs.13,415 Crore in QE Jun-22 with quarterly decline rate of 1.12%. The Y-O-Y decline rate of 0.38% has been recorded in pass-through charges for QE Jun-22.
The License Fee increased from Rs. Rs.4,712 Crore for the QE Mar-22 to Rs.4,844 Crore for the QE Jun-22. The quarterly and the Y-O-Y growth rates of license fee are 2.79% and 18.05% respectively in this quarter.
Service-wise composition of Adjusted Gross Revenue
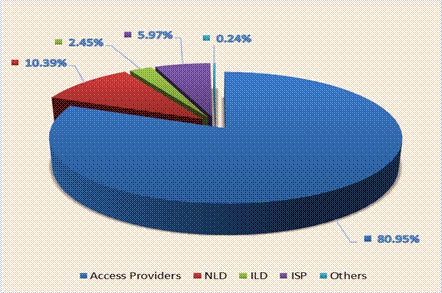
Access services contributed 80.95% of the total Adjusted Gross Revenue of telecom services. In Access services, Gross Revenue (GR), Adjusted Gross Revenue (AGR), License Fee, Spectrum Usage Charges (SUC) and Pass Through Charges increased by 1.67%, 5.55%, 5.53%, 3.82% and -3.41% respectively in QE Jun-22.
The performance of wireline service providers in terms of QoS during the quarter vis-à-vis that in the previous quarter is given below: -
|
Parameters showing improvement
in QoS
|
Parameters showing deterioration in QoS
|
- %age of calls answered by the operators (voice to voice) within 90 seconds ≥ 95%
|
- No case of deterioration of any parameter observed in QE June 2022
|
The performance of Cellular Mobile service providers in terms of Quality of Service performance in all the parameters remain same i.e. neither performance has improved nor deteriorated in this quarter, as compared to the previous quarter.
A total of approximately 892 private satellite TV channels have been permitted by the Ministry of Information and Broadcasting (MIB) for uplinking only/downlinking only/both uplinking & downlinking.
As per the reporting done by broadcasters in pursuance of the Tariff Order dated 3rd March 2017 as amended, out of 879 permitted satellite TV channels which are available for downlinking in India, there are 347 satellite pay TV channels as on 30th June 2022. Out of 347 pay channels, 249 are SD satellite pay TV channels and 98 are HD satellite pay TV channels.
Since the introduction of DTH Sector in the year 2003, Indian DTH (direct-to-home) services have displayed a phenomenal growth. During the QE 30th June 2022, there were 4 pay DTH service providers in the country.
Pay DTH has attained total active subscriber base of around 67.04 million in QE 30th June 2022. This is in addition to the subscribers of the DD Free Dish (free DTH services of Doordarshan).
Apart from the radio channels operated by All India Radio – the public broadcaster, as per the data reported by FM Radio operators to TRAI, as on 30th June 2022, there are 388 operational private FM Radio channels in 113 cities operated by 36 private FM Radio operators.
The advertisement revenue reported by FM Radio operators during the quarter ending 30th June 2022 in respect of 388 private FM Radio channels is Rs 345.12 crore as against Rs 362.63 crore in respect of 386 private FM Radio channels for the previous quarter i.e. 31st March 2022.
As on 30th June 2022, 366 Community Radio stations are operational.
SNAPSHOT
|
(Data as on Q.E. 30th June, 2022)
|
|
Telecom Subscribers (Wireless+Wireline)
|
|
Total Subscribers
|
1,172.96 Million
|
|
|
% change over the previous quarter
|
0.52%
|
|
|
Urban Subscribers
|
649.09 Million
|
|
|
Rural Subscribers
|
523.87 Million
|
|
|
Market share of Private Operators
|
89.38%
|
|
|
Market share of PSU Operators
|
10.62%
|
|
|
Tele-density
|
85.13%
|
|
|
Urban Tele-density
|
134.72%
|
|
|
Rural Tele-density
|
58.46%
|
|
|
Wireless Subscribers
|
|
Total Wireless Subscribers
|
1,147.39 Million
|
|
|
% change over the previous quarter
|
0.46%
|
|
|
Urban Subscribers
|
625.49 Million
|
|
|
Rural Subscribers
|
521.90 Million
|
|
|
Market share of Private Operators
|
90%
|
|
|
Market share of PSU Operators
|
10%
|
|
|
Tele-density
|
83.27%
|
|
|
Urban Tele-density
|
129.82%
|
|
|
Rural Tele-density
|
58.24%
|
|
|
Total Wireless Data Usage during the quarter
|
37,626 PB
|
|
|
Number of Public Mobile Radio Trunk Services (PMRTS)
|
66,048
|
|
|
Number of Very Small Aperture Terminals (VSAT)
|
2,76,971
|
|
|
Wireline Subscribers
|
|
Total Wireline Subscribers
|
25.57 Million
|
|
|
% change over the previous quarter
|
2.92%
|
|
|
Urban Subscribers
|
23.60 Million
|
|
|
Rural Subscribers
|
1.97 Million
|
|
|
Market share of PSU Operators
|
38.47%
|
|
|
Market share of Private Operators
|
61.53%
|
|
|
Tele-density
|
1.86%
|
|
|
Rural Tele-density
|
0.22%
|
|
|
Urban Tele-density
|
4.90%
|
|
|
No. of Village Public Telephones (VPT)
|
68,606
|
|
|
No. of Public Call Office (PCO)
|
61,427
|
|
|
Telecom Financial Data
|
|
Gross Revenue (GR) during the quarter
|
Rs.76,408 Crore
|
|
% change in GR over the previous quarter
|
-0.01%
|
|
Adjusted Gross Revenue (AGR) during the quarter
|
Rs.60,530 Crore
|
|
% change in AGR over the previous quarter
|
2.79%
|
|
Share of Public sector undertakings in Access AGR
|
4.88%
|
|
Internet/Broadband Subscribers
|
|
Total Internet Subscribers
|
836.86 Million
|
|
% change over previous quarter
|
1.45%
|
|
Narrowband subscribers
|
35.92 Million
|
|
Broadband subscribers
|
800.94 Million
|
|
Wired Internet Subscribers
|
28.73 Million
|
|
Wireless Internet Subscribers
|
808.13 Million
|
|
Urban Internet Subscribers
|
497.56 Million
|
|
Rural Internet Subscribers
|
339.30 Million
M
|
|
Total Internet Subscribers per 100 population
|
60.73
|
|
Urban Internet Subscribers per 100 population
|
103.27
|
|
Rural Internet Subscribers per 100 population
|
37.86
|
|
No. of Public Wi-Fi Hotspots
|
1,00,206
|
|
Aggregate Data Consumed (GB)
|
1,42,16,743
|
|
Broadcasting & Cable Services
|
|
Number of private satellite TV channels permitted by the Ministry of I&B for uplinking only/downlinking only/both uplinking and downlinking
|
892
|
|
Number of Pay TV Channels as reported by broadcasters
|
347
|
|
Number of private FM Radio Stations (excluding All India Radio)
|
388
|
|
Number of total active subscribers with pay DTH operators
|
67.04 Million
|
|
Number of Operational Community Radio Stations
|
366
|
|
Number of pay DTH Operators
|
4
|
|
Revenue & Usage Parameters
|
|
Monthly ARPU of Wireless Service
|
Rs.133.55
|
|
Minutes of Usage (MOU) per subscriber per month - Wireless Service
|
914 Minutes
|
|
Total Outgoing Minutes of Usage for Internet Telephony
|
98.31 Million
|
|
Wireless Data Usage
|
|
Average Wireless Data Usage per wireless data subscriber per month
|
16.40 GB
|
|
Average revenue realization per subscriber per GB wireless data during the quarter
|
Rs.10.29
|
***
RKJ/BK
(Release ID: 1878361)
Visitor Counter : 4195