Ministry of Petroleum & Natural Gas
Monthly Production Report April, 2022
Posted On:
24 MAY 2022 2:01PM by PIB Delhi
- Production of Crude Oil
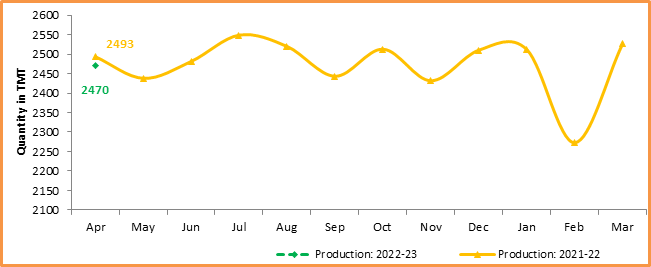
Crude oil production[1] during April, 2022 was 2469.67 TMT which is 3.47% higher than target but 0.95% lower than the production during April, 2021. Unit-wise and State-wise crude oil production is given at Annexure-I. Unit-wise crude oil production for the month of April, 2022 vis-à-vis same period of last year are shown in Table-1 and month-wise in Figure-1.
Table-1: Crude Oil Production (in TMT)
|
Oil & Gas Company
|
Target
|
April (Month)
|
|
2022-23 (Apr-Mar)
|
2022-23
|
2021-22
|
% over last year
|
|
Target
|
Prod.*
|
Prod.
|
|
ONGC (Nomination Block)
|
19088.24
|
1573.05
|
1650.65
|
1636.57
|
100.86
|
|
OIL (Nomination Block)
|
3571.00
|
253.47
|
251.46
|
242.74
|
103.59
|
|
Pvt/JVs (PSC/RSC Regime)
|
7561.01
|
560.40
|
567.57
|
613.95
|
92.45
|
|
Total
|
30220.26
|
2386.92
|
2469.67
|
2493.26
|
99.05
|
Note: 1. Target for the year 2022-23 is provisional, subject to finalization. *: Provisional
- Totals may not tally due to rounding off.
Figure-1: Monthly Crude Oil Production

Unit-wise production details with reasons for shortfall are as under:
-
- Crude oil production by ONGC (Oil and Natural Gas Corporation) in nomination block during April, 2022 was 1650.65 TMT which is 4.93% higher than the target and 0.86% higher than the production during April, 2021.
-
- Crude oil production by OIL (Oil India Ltd) in the nomination block during April, 2022 was 251.46 TMT which is 0.79% lower than target but 3.59% higher than the production during April, 2020. Reasons for shortfall in production are as under:
- Less than planned contribution from workover wells, drilling wells and old wells.
- Bandhs /blockade by local people and associations etc. after the Baghjan Blowout, protests/agitation etc.
-
- Crude oil production by Pvt/JVs companies in the PSC/RSC (Production Sharing Contract) regime during April, 2022 was 567.57 TMT which is 1.28% higher than the target but 7.55% lower than the production during April, 2021. Reasons for shortfall in production are as under:
- AAP-ON-94/1 (HOEC): Production Shortfall due to Low consumer demand.
- AMGURI (OILMAX): Production Shortfall due to Low consumer demand.
- CB-ONN-2004/2 (ONGC): One development well in VD-3 discovery could not be drilled as planned.
- BAOLA (SUN): Production shortfall due to less than planned contribution from workover wells.
- Production of Natural Gas
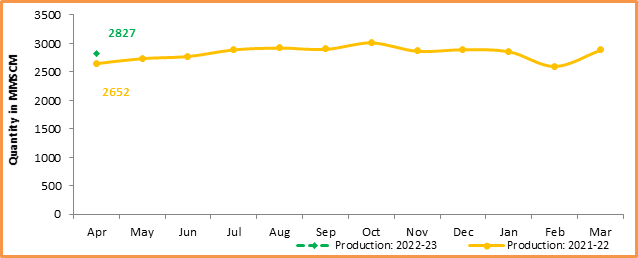
Natural gas production during April,2022 was 2826.73 MMSCM which is 2.29% lower than the monthly target but 6.61% higher than the production during April, 2021. Unit-wise and state-wise natural gas production are given at Annexure-II. Unit-wise natural gas production for the month of April, 2022 and same period of last year are shown in Table-2 and month-wise in Figure-2.
Table-2: Natural Gas Production (in MMSCM)
|
Oil Company
|
Target
|
April (Month)
|
|
2022-23 (Apr-Mar)
|
2022-23
|
2021-22
|
% over last year
|
|
Target
|
Prod.*
|
Prod.
|
|
ONGC (Nomination Block)
|
20798.12
|
1697.48
|
1707.99
|
1725.50
|
98.99
|
|
OIL (Nomination Block)
|
3717.84
|
303.51
|
244.92
|
215.13
|
113.85
|
|
Pvt/JVs (PSC/RSC Regime)
|
12049.45
|
891.87
|
873.82
|
710.90
|
122.92
|
|
Total
|
36565.41
|
2892.86
|
2826.73
|
2651.52
|
106.61
|
Note: 1. Target for the year 2022-23 is provisional, subject to finalization. *: Provisional
- Totals may not tally due to rounding off.
Figure-2: Monthly Natural Gas Production

-
- Natural gas production by ONGC in the nomination blocks during April, 2022 was 1707.99 MMSCM which is 0.62% higher than the target but 1.01% lower than the production during April, 2021. Reasons for shortfall in production are as under:
- Delay of HF in Mandapeta & Natural Decline in Pasarlapudi and CA-16 fields in Rajahmundry
- Decline in production from Gandhar, Jambusar and Dahej fields in Ankleshwar Asset.
-
- Natural gas production by OIL in the nomination block during April, 2022 was 244.92 MMSCM which is 19.30% lower than the monthly target but 13.85% higher than the production during April, 2021. Reasons for shortfall in production are as under:
- Low upliftment/demand of gas by the major customers.
- Less than planned contribution from workover wells, drilling wells and old wells.
-
- Natural gas production by Pvt/JVs companies in the PSC/RSC & CBM regime during April, 2022 was 873.82 MMSCM which is 2.02% lower than the target but 22.92% higher than the production during April, 2021.
- AAP-ON-94/1 (HOEC): Production Shortfall due to Low consumer demand.
- AMGURI (OILMAX): Production Shortfall due to Low consumer demand.
- RJ-ON/6 (FEL): Production shortfall due to compressor failures at Plant (Tripping issues).
- BAOLA (SUN): Production shortfall due to less than planned contribution from workover wells.
- KG-DWN-98/3 (RIL): Production shortfall due to closer of #AR1-Dev1 for build-up study from 16.04.2022 to 19.04.2022
- Crude Oil Processed (Crude Throughput)
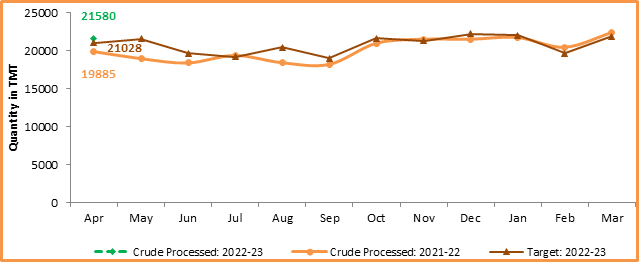
Crude Oil Processed during April, 2022 was 21579.61 TMT which is 2.62% higher than the target for the month and 8.52% higher vis-à-vis April, 2021. Capacity utilization during the April, 2022 was 104.51%. Refinery-wise details of the crude throughput and capacity utilization during the month of April, 2022 vis-à-vis April, 2021 are given at Annexure-III and Annexure-IV. Company-wise crude throughput for the month of April, 2022 vis-à-vis same period of last year are shown in Table-3 and month-wise in Figure-3.
Table 3: Crude Oil Processed (Crude Throughput) (in TMT)
|
Oil Company
|
Target
|
April (Month)
|
|
2022-23 (Apr-Mar)
|
2022-23
|
2021-22
|
% over last year
|
|
Target
|
Prod.*
|
Prod.
|
|
CPSE
|
154983.78
|
13422.92
|
13728.86
|
12172.03
|
112.79
|
|
IOCL
|
69999.90
|
6085.05
|
6237.26
|
5980.31
|
104.30
|
|
BPCL
|
37000.00
|
3320.00
|
3300.36
|
3236.27
|
101.98
|
|
HPCL
|
18920.85
|
1525.90
|
1529.30
|
867.43
|
176.30
|
|
CPCL
|
10300.00
|
900.00
|
904.20
|
759.79
|
119.01
|
|
NRL
|
2800.00
|
236.62
|
270.72
|
221.22
|
122.38
|
|
MRPL
|
15900.00
|
1350.00
|
1480.97
|
1099.79
|
134.66
|
|
ONGC
|
63.04
|
5.36
|
6.05
|
7.23
|
83.70
|
|
Pvt/JVs
|
94637.83
|
7605.33
|
7850.75
|
7712.67
|
101.79
|
|
HMEL
|
11451.93
|
951.56
|
1039.86
|
1058.90
|
98.20
|
|
RIL
|
63021.49
|
5020.99
|
5150.91
|
5020.99
|
102.59
|
|
NEL
|
20164.41
|
1632.78
|
1659.98
|
1632.78
|
101.66587
|
|
TOTAL
|
249621.61
|
21028.25
|
21579.61
|
19884.70
|
108.52
|
Note: 1. Target for the year 2022-23 is provisional, subject to finalization. *: Provisional
2. Totals may not tally due to rounding off.
Figure 3: Crude Oil Processed (Crude Throughput)

3.1 CPSE Refineries’ crude oil processed during April, 2022 was 13728.86 TMT which is 2.28% higher than the target for the month and 12.79% higher than that of April, 2021. Reasons for shortfall in production are as under:
- IOCL-Panipat: Crude processed lower due to high TAN crude processing.
- HPCL-Mumbai: Crude processed lower due to shutdown of secondary processing unit.
3.2 Private and JVs Refineries’ crude oil processed during April, 2022 was 7850.75 TMT which is 3.23% higher than the target for the month and 1.79% higher than that of April, 2021.
- Production of Petroleum Products
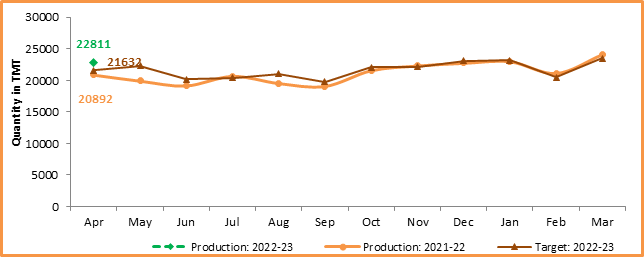
Production of Petroleum Products during April, 2022 was 22811.15 TMT which is 5.45% higher than the target for the month and 9.19% higher than the production during April, 2021. Refinery-wise production of petroleum products is given at Annexure-V. Company-wise production for the month of April, 2022 vis-à-vis April, 2021 are shown in Table-4 and month-wise in Figure-4.
Table 4: Production of Petroleum Products (TMT)
|
Oil Company
|
Target
|
April (Month)
|
|
2022-23
(Apr-Mar)
|
2022-23
|
2021-22
|
% over last year
|
|
Target
|
Prod.*
|
Prod.
|
|
CPSE
|
144648.94
|
12545.20
|
12939.59
|
11566.88
|
111.87
|
|
IOCL
|
66322.30
|
5776.84
|
5919.84
|
5795.76
|
102.14
|
|
BPCL
|
34005.99
|
3056.00
|
3178.54
|
3125.04
|
101.71
|
|
HPCL
|
17495.57
|
1416.78
|
1471.63
|
807.56
|
182.23
|
|
CPCL
|
9614.24
|
839.94
|
775.34
|
611.19
|
126.86
|
|
NRL
|
2748.86
|
232.30
|
266.66
|
219.63
|
121.42
|
|
MRPL
|
14401.95
|
1218.24
|
1321.87
|
1000.96
|
132.06
|
|
ONGC
|
60.02
|
5.10
|
5.70
|
6.74
|
84.54
|
|
Pvt/JVs
|
111404.56
|
8820.05
|
9594.65
|
8958.81
|
107.10
|
|
HMEL
|
10528.86
|
894.97
|
990.40
|
1033.73
|
95.81
|
|
RIL
|
81492.18
|
6374.66
|
7048.66
|
6374.66
|
110.57
|
|
NEL
|
19383.52
|
1550.42
|
1555.59
|
1550.42
|
100.33
|
|
Total Refinery
|
256053.50
|
21365.24
|
22534.24
|
20525.69
|
109.79
|
|
Fractionators
|
3888.14
|
266.71
|
276.91
|
365.98
|
75.66
|
|
TOTAL
|
259941.64
|
21631.96
|
22811.15
|
20891.67
|
109.19
|
Note: 1. Target for the year 2022-23 is provisional, subject to finalization. *: Provisional
2. Totals may not tally due to rounding off.
Figure 4: Monthly Refinery Production of Petroleum Products:

-
- Production of petroleum Products by Oil’s Refineries during April, 2022 was 22534.24 TMT which is 5.47% higher than the target for the month and 9.79% higher than the production during April, 2021.
-
- Production of petroleum Products by Fractionators during April, 2022 was 276.91 TMT which is 3.82% higher than the target for the month but 24.34% higher than the production during April, 2021.
Click here to see Annexure-I (Para-1)
Click here to see Annexure-II (Para-2)
Click here to see Annexure-III (Para-3)
Click here to see Annexure-IV (Para-3)
Click here to see Annexure-V (Para-4)
********
(Release ID: 1827879)
Visitor Counter : 1824