Posted On:
16 NOV 2026 4:00PM by PIB Mumbai
नवी दिल्ली, 16 नोव्हेंबर 2026
ऑक्टोबर 2026 मधल्या घाऊक किंमत निर्देशांकाची (आधार वर्ष 2022-23) ठळक वैशिष्ट्ये
1. ऑक्टोबर 2026 मध्ये संपूर्ण भारताचा घाऊक किंमत निर्देशांकावर आधारित महागाई दर वार्षिक (YoY) आधारावर 12.29 टक्के नोंदवण्यात आला. सप्टेंबर 2026 मध्ये हा दर 11.39 टक्के होता. ऑक्टोबर 2026 मध्ये सर्व वस्तूंचा निर्देशांक 113.3 होता, तर सप्टेंबर 2026 मध्ये तो 112.5 होता.
2. प्रमुख गटांचे वार्षिक महागाई दर पुढीलप्रमाणे आहेत. ऑक्टोबर 2026 मध्ये प्राथमिक वस्तू, इंधन आणि वीज, तसेच उत्पादित वस्तू या गटांचे महागाई दर अनुक्रमे 9.24 टक्के, 32.84 टक्के आणि 9.54 टक्के होते. सप्टेंबर 2026 मध्ये हे दर अनुक्रमे 8.67 टक्के, 25.85 टक्के आणि 9.76 टक्के होते. ऑक्टोबर 2026 मध्ये प्राथमिक वस्तू, इंधन आणि वीज, तसेच उत्पादित वस्तू यांचे निर्देशांक अनुक्रमे 120.6, 115.7 आणि 110.2 होते. सप्टेंबर 2026 मध्ये हे निर्देशांक अनुक्रमे 120.3, 110.5 आणि 110.2 होते.
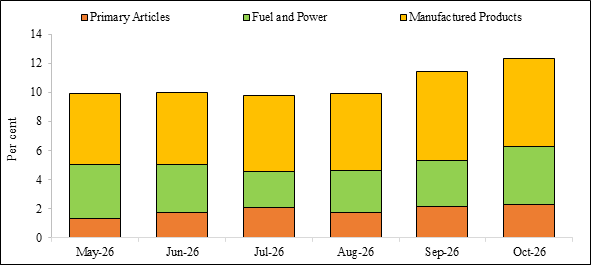
3. विविध गटांमध्ये खनिज तेल, यात पेट्रोलियम पदार्थांचा समावेश आहे, कच्चे खनिज तेल आणि नैसर्गिक वायू, वीज, खाद्यपदार्थ, मूलभूत धातूंचे उत्पादन, रसायने आणि रासायनिक उत्पादनांचे उत्पादन, खाद्यपदार्थांचे उत्पादन, बिगरखाद्य वस्तू, वस्त्रोद्योग आणि रबर व प्लास्टिक उत्पादनांचे उत्पादन या घटकांमुळे ऑक्टोबर 2026 मधील घाऊक किंमत निर्देशांकावर आधारित महागाईत वाढ झाली.
4. घाऊक अन्नपदार्थ किंमत निर्देशांक (भारांक = 24.99 टक्के) : या निर्देशांकामध्ये प्राथमिक वस्तू या प्रमुख गटातील खाद्यपदार्थ आणि उत्पादित वस्तू या प्रमुख गटातील खाद्यपदार्थांचे उत्पादन यांचा समावेश होतो. ऑक्टोबर 2026 मध्ये या निर्देशांकावर आधारित वार्षिकमहागाई दर 8.58 टक्के होता. सप्टेंबर 2026 मध्ये तो 8.66 टक्के होता.
5. सर्व वस्तू आणि प्रमुख गटांचे मासिक निर्देशांक आणि महागाई दर (टक्क्यांमध्ये), तसेच मागील काही महिन्यांतील प्रमुख गटांचे योगदान खालील आलेखांमध्ये दिले आहे.
Chart 1: WPI Index and Inflation Rate for All Commodities
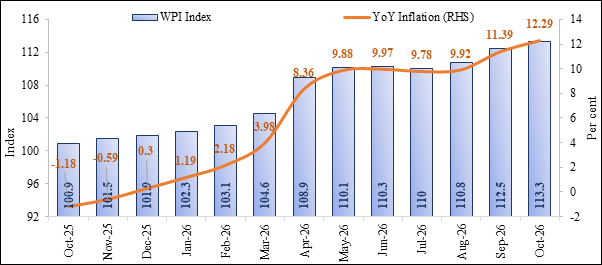
Chart 2: WPI Index of Major Groups
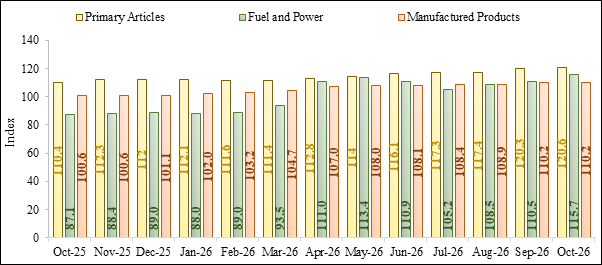
Chart 3: Inflation Rate across Major Groups
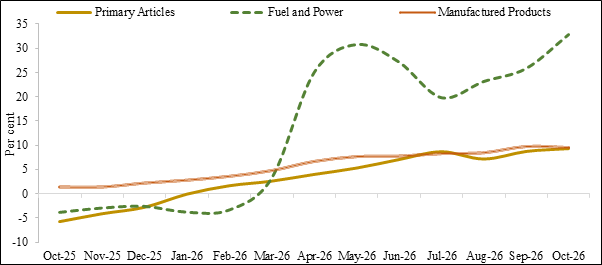
Chart 4: Major Group-Wise contribution to Inflation
ऑगस्ट 2026 महिन्यासाठी अंतिम निर्देशांक
1. ऑगस्ट 2026 महिन्याचा अंतिम निर्देशांक तात्पुरत्या निर्देशांकाप्रमाणेच 110.8 इतका कायम आहे. त्यानुसार, ऑगस्ट 2026 मधील घाऊक किंमत निर्देशांकावर आधारित महागाई दरही अंतिम आकडेवारीनुसार 9.92 टक्के इतकाच कायम आहे.
2. ऑगस्ट 2026 महिन्यासाठी घाऊक किंमत निर्देशांकाची (आधार वर्ष 2022-23) अंतिम आकडेवारी 99.37 टक्के भारित प्रतिसाद दराच्या आधारे तयार करण्यात आली आहे.
3. ऑक्टोबर 2026 महिन्यासाठी घाऊक किंमत निर्देशांकाची (आधार वर्ष 2022-23) तात्पुरती आकडेवारी 81.1 टक्के भारित प्रतिसाद दराच्या आधारे तयार करण्यात आली आहे.
4. गेल्या सहा महिन्यांतल्या सर्व वस्तू, प्रमुख गट आणि उपगटांचे घाऊक किंमत निर्देशांक आणि वार्षिकमहागाई दर अनुक्रमे परिशिष्ट-I आणि II मध्ये दिले आहेत.
5. आर्थिक वर्ष 2023-24, 2024-25, 2025-26 आणि 2026-27 या वर्षांमध्ये एप्रिल ते ऑक्टोबर या कालावधीतील सर्व वस्तू, प्रमुख गट आणि उपगटांचे संचयी घाऊक किंमत निर्देशांक परिशिष्ट-III मध्ये दिले आहेत.
6. आर्थिक वर्ष 2024-25, 2025-26 आणि 2026-27 या वर्षांमध्ये एप्रिल ते ऑक्टोबर या कालावधीतील सर्व वस्तू, प्रमुख गट आणि उपगटांचा संचयी वार्षिक महागाई दर परिशिष्ट-IV मध्ये दिला आहे.
7. एप्रिल 2023 ते ऑक्टोबर 2026 या कालावधीतल्या घाऊक किंमत निर्देशांकाच्या (आधार वर्ष 2022-23) मालिकेतली वस्तुनिहाय आकडेवारी https://eaindustry.nic.in/download_data_2223.asp या संकेतस्थळावर उपलब्ध आहे.
8. संदर्भ महिन्यासाठी घाऊक किंमत निर्देशांक, उत्पादन उत्पादक किंमत निर्देशांक आणि प्रायोगिक निविष्ठा उत्पादक किंमत निर्देशांकाची तात्पुरती आकडेवारी पुढील महिन्याच्या 14 तारखेला प्रसिद्ध केली जाते. त्या दिवशी सुट्टी असल्यास पुढील कामकाजाच्या दिवशी ती प्रसिद्ध केली जाते. त्यानुसार, नोव्हेंबर 2026 महिन्यासाठीचे घाऊक किंमत निर्देशांक, उत्पादन उत्पादक किंमत निर्देशांक आणि प्रायोगिक निविष्ठा उत्पादक किंमत निर्देशांक सोमवार, 14 डिसेंबर 2026 रोजी प्रसिद्ध केले जातील.
Annexure-I
WPI for All Commodities, Major Groups and Groups for last six months
|
Groups/Major Groups
|
Commodity Weight
|
May-26
(F)
|
Jun-26
(F)
|
Jul-26
(F)
|
Aug-26
(F)
|
Sep-26
(P)
|
Oct-26
(P)
|
|
ALL COMMODITIES
|
100.00000
|
110.1
|
110.3
|
110.0
|
110.8
|
112.5
|
113.3
|
|
I. PRIMARY ARTICLES
|
22.75730
|
114.0
|
116.1
|
117.3
|
117.4
|
120.3
|
120.6
|
|
(A). Food Articles
|
15.97835
|
115.1
|
117.2
|
118.2
|
118.5
|
122.2
|
121.9
|
|
(B). Non-Food Articles
|
5.52841
|
109.1
|
111
|
112.6
|
112.4
|
113.7
|
115.6
|
|
(C). Minerals
|
1.25054
|
121.0
|
123.8
|
125.8
|
125.4
|
125.5
|
126.5
|
|
II. FUEL AND POWER
|
14.11433
|
113.4
|
110.9
|
105.2
|
108.5
|
110.5
|
115.7
|
|
(A). Coal and Lignite
|
0.74136
|
86.6
|
87.9
|
88.4
|
90.5
|
95.1
|
96.9
|
|
(B). Mineral Oils
|
8.19208
|
125.7
|
122.9
|
113.2
|
118.4
|
119.3
|
124.9
|
|
(C). Electricity
|
4.46349
|
91.5
|
91.2
|
91.8
|
91.4
|
92.0
|
96.5
|
|
(D). Crude Petroleum & Natural Gas
|
0.71740
|
136.8
|
120.2
|
114.8
|
120.3
|
141.9
|
148.6
|
|
III. MANUFACTURED PRODUCTS
|
63.12837
|
108.0
|
108.1
|
108.4
|
108.9
|
110.2
|
110.2
|
|
(A). Manufacture of Food Products
|
9.02016
|
112.4
|
113.5
|
114.9
|
116.5
|
117.1
|
117.1
|
|
(B). Manufacture of Beverages
|
0.90483
|
104.9
|
105.1
|
104.6
|
105.3
|
105.9
|
106.0
|
|
(C). Manufacture of Tobacco Products
|
0.27645
|
122.8
|
124.8
|
125.1
|
125.2
|
124.3
|
125.7
|
|
(D). Manufacture of Textiles
|
4.08993
|
102.1
|
103.4
|
103.9
|
104
|
105.2
|
104.8
|
|
(E). Manufacture of Wearing Apparel
|
1.32948
|
111.6
|
111.9
|
111.9
|
112.2
|
113.1
|
112.7
|
|
(F). Manufacture of Leather and Related Products
|
0.54137
|
108.4
|
108.9
|
108.7
|
108.7
|
109.1
|
109.3
|
|
(G). Manufacture Of Wood and Products of Wood and Cork, except Furniture; Manufacture of Articles of Straw and Plaiting Materials
|
1.07718
|
115.0
|
115.4
|
115.9
|
115.6
|
115.3
|
115.4
|
|
(H). Manufacture of Paper and Paper Products
|
1.15328
|
94.1
|
93.8
|
94.4
|
94.7
|
96.0
|
96.9
|
|
(I). Printing and Reproduction of Recorded Media
|
0.42618
|
108.1
|
108.0
|
108.0
|
108.0
|
108.6
|
108.3
|
|
(J). Manufacture of Chemicals and Chemical Products
|
6.12567
|
103.6
|
103.8
|
103.0
|
104.0
|
106.0
|
106.6
|
|
(K). Manufacture of Basic Pharmaceutical Products and Pharmaceutical Preparations
|
2.20102
|
102.9
|
102.8
|
103.2
|
102.6
|
103.8
|
102.9
|
|
(L). Manufacture of Rubber and Plastic Products
|
2.71467
|
106.3
|
106.7
|
106.6
|
107.1
|
108.7
|
109.0
|
|
(M). Manufacture of Other Non-Metallic Mineral Products
|
2.84074
|
99.2
|
99.8
|
100.0
|
99.6
|
100.4
|
100.2
|
|
(N). Manufacture of Basic Metals
|
8.41133
|
104.9
|
101.6
|
102.0
|
102.7
|
106.2
|
106.9
|
|
(O). Manufacture of Fabricated Metal Products, except Machinery and Equipment
|
4.13294
|
105.9
|
106.1
|
106.6
|
106.8
|
107.4
|
107.4
|
|
(P). Manufacture of Computer, Electronic and Optical Products
|
2.07628
|
102.7
|
103.4
|
103.2
|
103.6
|
104.1
|
104.3
|
|
(Q). Manufacture of Electrical Equipment
|
2.64318
|
114.2
|
115.0
|
115.5
|
116.1
|
117.3
|
116.8
|
|
(R). Manufacture of Machinery and Equipment n.e.c.
|
3.46796
|
105.3
|
105.5
|
106.2
|
106.2
|
106.6
|
106.7
|
|
(S). Manufacture of Motor Vehicles, Trailers and Semi-Trailers
|
5.43645
|
107.0
|
108.7
|
109.1
|
109.5
|
110.0
|
110.3
|
|
(T). Manufacture of Other Transport Equipment
|
1.39511
|
106.4
|
107.2
|
108.1
|
108.1
|
109.0
|
108.7
|
|
(U). Manufacture of Furniture
|
0.82618
|
105.6
|
105.8
|
105.7
|
105.4
|
105.7
|
106.8
|
|
(V). Other Manufacturing
|
2.03798
|
158.2
|
156.8
|
154.2
|
154.2
|
156.1
|
152.1
|
|
FOOD INDEX
|
24.99851
|
114.1
|
115.9
|
117.0
|
117.8
|
120.4
|
120.2
|
(P)-Provisional, (F)-Final
Annexure-II
WPI Inflation Rate (YoY) for All Commodities, Major Groups, and Groups for last six months
|
Groups/Major Groups
|
Commodity Weight
|
May-26
(F)
|
Jun-26
(F)
|
Jul-26
(F)
|
Aug-26
(F)
|
Sep-26
(P)
|
Oct-26
(P)
|
|
ALL COMMODITIES
|
100.00000
|
9.88
|
9.97
|
9.78
|
9.92
|
11.39
|
12.29
|
|
I. PRIMARY ARTICLES
|
22.75730
|
5.26
|
7.00
|
8.61
|
7.12
|
8.67
|
9.24
|
|
(A). Food Articles
|
15.97835
|
3.69
|
5.40
|
5.44
|
4.96
|
8.14
|
8.26
|
|
(B). Non-Food Articles
|
5.52841
|
10.20
|
11.67
|
17.66
|
13.88
|
10.28
|
11.69
|
|
(C). Minerals
|
1.25054
|
6.05
|
8.31
|
13.64
|
8.76
|
9.51
|
12.64
|
|
II. FUEL AND POWER
|
14.11433
|
30.80
|
27.18
|
19.82
|
23.16
|
25.85
|
32.84
|
|
(A). Coal and Lignite
|
0.74136
|
-2.26
|
-1.57
|
-0.56
|
1.57
|
9.31
|
10.49
|
|
(B). Mineral Oils
|
8.19208
|
49.82
|
46.48
|
32.4
|
38.48
|
40.02
|
45.57
|
|
(C). Electricity
|
4.46349
|
-0.54
|
-1.51
|
0.44
|
-1.19
|
-0.43
|
8.06
|
|
(D). Crude Petroleum & Natural Gas
|
0.71740
|
61.51
|
34.75
|
26.99
|
34.41
|
57.32
|
70.80
|
|
III. MANUFACTURED PRODUCTS
|
63.12837
|
7.68
|
7.78
|
8.29
|
8.47
|
9.76
|
9.54
|
|
(A). Manufacture of Food Products
|
9.02016
|
6.24
|
7.58
|
8.70
|
9.18
|
9.44
|
9.24
|
|
(B). Manufacture of Beverages
|
0.90483
|
1.25
|
1.15
|
0.48
|
1.54
|
1.44
|
2.12
|
|
(C). Manufacture of Tobacco Products
|
0.27645
|
12.76
|
14.60
|
13.73
|
13.71
|
12.90
|
13.24
|
|
(D). Manufacture of Textiles
|
4.08993
|
10.98
|
12.15
|
12.69
|
12.31
|
13.85
|
13.67
|
|
(E). Manufacture of Wearing Apparel
|
1.32948
|
3.72
|
2.57
|
3.61
|
2.94
|
3.57
|
3.30
|
|
(F). Manufacture of Leather and Related Products
|
0.54137
|
4.23
|
3.91
|
3.92
|
3.52
|
3.71
|
5.60
|
|
(G). Manufacture Of Wood and Products of Wood and Cork, except Furniture; Manufacture of Articles of Straw and Plaiting Materials
|
1.07718
|
6.58
|
7.65
|
7.41
|
7.53
|
5.97
|
5.68
|
|
(H). Manufacture of Paper and Paper Products
|
1.15328
|
2.95
|
3.19
|
3.40
|
4.18
|
5.15
|
6.72
|
|
(I). Printing and Reproduction of Recorded Media
|
0.42618
|
3.94
|
3.45
|
3.25
|
2.56
|
3.04
|
3.24
|
|
(J). Manufacture of Chemicals and Chemical Products
|
6.12567
|
14.73
|
14.32
|
13.56
|
14.41
|
16.74
|
17.53
|
|
(K). Manufacture of Basic Pharmaceutical Products and Pharmaceutical Preparations
|
2.20102
|
3.94
|
3.42
|
4.35
|
2.70
|
4.01
|
3.00
|
|
(L). Manufacture of Rubber and Plastic Products
|
2.71467
|
10.84
|
10.46
|
10.70
|
10.87
|
13.47
|
13.90
|
|
(M). Manufacture of Other Non-Metallic Mineral Products
|
2.84074
|
1.33
|
2.04
|
2.77
|
2.47
|
3.72
|
3.94
|
|
(N). Manufacture of Basic Metals
|
8.41133
|
13.16
|
10.68
|
12.33
|
12.86
|
16.96
|
17.21
|
|
(O). Manufacture of Fabricated Metal Products, except Machinery and Equipment
|
4.13294
|
6.33
|
6.53
|
7.24
|
7.01
|
7.51
|
7.72
|
|
(P). Manufacture of Computer, Electronic and Optical Products
|
2.07628
|
-0.87
|
-0.86
|
-1.81
|
-1.61
|
4.00
|
4.20
|
|
(Q). Manufacture of Electrical Equipment
|
2.64318
|
11.41
|
11.22
|
11.38
|
11.21
|
11.93
|
10.40
|
|
(R). Manufacture of Machinery and Equipment n.e.c.
|
3.46796
|
2.23
|
2.23
|
2.81
|
2.41
|
2.80
|
2.99
|
|
(S). Manufacture of Motor Vehicles, Trailers and Semi-Trailers
|
5.43645
|
0.75
|
3.23
|
3.31
|
3.89
|
4.46
|
4.35
|
|
(T). Manufacture of Other Transport Equipment
|
1.39511
|
4.11
|
4.69
|
4.85
|
4.44
|
4.21
|
3.62
|
|
(U). Manufacture of Furniture
|
0.82618
|
5.18
|
4.44
|
4.24
|
4.98
|
5.17
|
6.37
|
|
(V). Other Manufacturing
|
2.03798
|
21.41
|
20.71
|
20.28
|
22.19
|
19.16
|
11.92
|
|
FOOD INDEX
|
24.99851
|
4.58
|
6.23
|
6.56
|
6.41
|
8.66
|
8.58
|
(P)-Provisional, (F)-Final
Annexure-III
Cumulative WPI for All Commodities, Major Groups, and Groups
|
Groups/Major Groups
|
Commodity Weight
|
Apr-Oct
FY 2023-24
|
Apr-Oct
FY 2024-25
|
Apr-Oct
FY 2025-26
|
Apr-Oct
FY 2026-27
|
|
ALL COMMODITIES
|
100.00000
|
99.2
|
100.9
|
100.6
|
110.8
|
|
I. PRIMARY ARTICLES
|
22.75730
|
105.4
|
112.9
|
109.1
|
116.9
|
|
(A). Food Articles
|
15.97835
|
107.6
|
117.7
|
112.0
|
118.2
|
|
(B). Non-Food Articles
|
5.52841
|
99.8
|
98.8
|
99.9
|
111.7
|
|
(C). Minerals
|
1.25054
|
100.9
|
113.5
|
113.0
|
123.8
|
|
II. FUEL AND POWER
|
14.11433
|
92.5
|
90.9
|
87.6
|
110.7
|
|
(A). Coal and Lignite
|
0.74136
|
92.8
|
90.0
|
88.5
|
90.4
|
|
(B). Mineral Oils
|
8.19208
|
90.7
|
89.1
|
85.2
|
120.9
|
|
(C). Electricity
|
4.46349
|
94.9
|
93.1
|
91.9
|
92.2
|
|
(D). Crude Petroleum & Natural Gas
|
0.71740
|
98.2
|
99.0
|
88.5
|
131.6
|
|
III. MANUFACTURED PRODUCTS
|
63.12837
|
98.4
|
98.8
|
100.3
|
108.7
|
|
(A). Manufacture of Food Products
|
9.02016
|
98.7
|
101.8
|
106.3
|
114.6
|
|
(B). Manufacture of Beverages
|
0.90483
|
102.4
|
103.8
|
103.9
|
105.2
|
|
(C). Manufacture of Tobacco Products
|
0.27645
|
104.6
|
107.0
|
109.8
|
124.3
|
|
(D). Manufacture of Textiles
|
4.08993
|
92.7
|
92.6
|
92.3
|
103.2
|
|
(E). Manufacture of Wearing Apparel
|
1.32948
|
102.6
|
105.0
|
108.5
|
112.1
|
|
(F). Manufacture of Leather and Related Products
|
0.54137
|
101.7
|
102.1
|
104.3
|
108.6
|
|
(G). Manufacture Of Wood and Products of Wood and Cork, except Furniture; Manufacture of Articles of Straw and Plaiting Materials
|
1.07718
|
102.2
|
103.7
|
107.9
|
115.4
|
|
(H). Manufacture of Paper and Paper Products
|
1.15328
|
90.3
|
90.1
|
91.2
|
94.8
|
|
(I). Printing and Reproduction of Recorded Media
|
0.42618
|
103.8
|
104.4
|
104.6
|
108.0
|
|
(J). Manufacture of Chemicals and Chemical Products
|
6.12567
|
92.9
|
91.2
|
90.7
|
104.2
|
|
(K). Manufacture of Basic Pharmaceutical Products and Pharmaceutical Preparations
|
2.20102
|
100.9
|
99.8
|
99.5
|
102.9
|
|
(L). Manufacture of Rubber and Plastic Products
|
2.71467
|
95.3
|
96.3
|
96.2
|
107.2
|
|
(M). Manufacture of Other Non-Metallic Mineral Products
|
2.84074
|
99.4
|
95.7
|
97.2
|
99.7
|
|
(N). Manufacture of Basic Metals
|
8.41133
|
94.8
|
92.9
|
91.7
|
104.0
|
|
(O). Manufacture of Fabricated Metal Products, except Machinery and Equipment
|
4.13294
|
100.2
|
99.7
|
99.6
|
106.4
|
|
(P). Manufacture of Computer, Electronic and Optical Products
|
2.07628
|
98.5
|
97.4
|
103.1
|
103.3
|
|
(Q). Manufacture of Electrical Equipment
|
2.64318
|
100.6
|
102.1
|
104.0
|
115.4
|
|
(R). Manufacture of Machinery and Equipment n.e.c.
|
3.46796
|
102.0
|
102.4
|
103.4
|
105.9
|
|
(S). Manufacture of Motor Vehicles, Trailers and Semi-Trailers
|
5.43645
|
104.1
|
105.9
|
105.6
|
108.8
|
|
(T). Manufacture of Other Transport Equipment
|
1.39511
|
101.5
|
101.2
|
103.3
|
107.6
|
|
(U). Manufacture of Furniture
|
0.82618
|
101.6
|
101.7
|
100.9
|
105.8
|
|
(V). Other Manufacturing
|
2.03798
|
104.4
|
111.1
|
129.4
|
155.5
|
|
FOOD INDEX
|
24.99851
|
104.4
|
112.0
|
109.9
|
116.9
|
Note: Cumulative Index has been calculated by taking Arithmetic Mean of 7 months indices
Annexure-IV
Cumulative WPI Inflation Rate (YoY) for All Commodities, Major Groups, and Groups
|
Groups/Major Groups
|
Commodity Weight
|
Apr-Oct
FY 2024-25
|
Apr-Oct
FY 2025-26
|
Apr-Oct
FY 2026-27
|
|
ALL COMMODITIES
|
100.00000
|
1.71
|
-0.30
|
10.14
|
|
I. PRIMARY ARTICLES
|
22.75730
|
7.12
|
-3.37
|
7.15
|
|
(A). Food Articles
|
15.97835
|
9.39
|
-4.84
|
5.54
|
|
(B). Non-Food Articles
|
5.52841
|
-1.00
|
1.11
|
11.81
|
|
(C). Minerals
|
1.25054
|
12.49
|
-0.44
|
9.56
|
|
II. FUEL AND POWER
|
14.11433
|
-1.73
|
-3.63
|
26.37
|
|
(A). Coal and Lignite
|
0.74136
|
-3.02
|
-1.67
|
2.15
|
|
(B). Mineral Oils
|
8.19208
|
-1.76
|
-4.38
|
41.9
|
|
(C). Electricity
|
4.46349
|
-1.90
|
-1.29
|
0.33
|
|
(D). Crude Petroleum & Natural Gas
|
0.71740
|
0.81
|
-10.61
|
48.70
|
|
III. MANUFACTURED PRODUCTS
|
63.12837
|
0.41
|
1.52
|
8.37
|
|
(A). Manufacture of Food Products
|
9.02016
|
3.14
|
4.42
|
7.81
|
|
(B). Manufacture of Beverages
|
0.90483
|
1.37
|
0.10
|
1.25
|
|
(C). Manufacture of Tobacco Products
|
0.27645
|
2.29
|
2.62
|
13.21
|
|
(D). Manufacture of Textiles
|
4.08993
|
-0.11
|
-0.32
|
11.81
|
|
(E). Manufacture of Wearing Apparel
|
1.32948
|
2.34
|
3.33
|
3.32
|
|
(F). Manufacture of Leather and Related Products
|
0.54137
|
0.39
|
2.15
|
4.12
|
|
(G). Manufacture Of Wood and Products of Wood and Cork, except Furniture; Manufacture of Articles of Straw and Plaiting Materials
|
1.07718
|
1.47
|
4.05
|
6.95
|
|
(H). Manufacture of Paper and Paper Products
|
1.15328
|
-0.22
|
1.22
|
3.95
|
|
(I). Printing and Reproduction of Recorded Media
|
0.42618
|
0.58
|
0.19
|
3.25
|
|
(J). Manufacture of Chemicals and Chemical Products
|
6.12567
|
-1.83
|
-0.55
|
14.88
|
|
(K). Manufacture of Basic Pharmaceutical Products and Pharmaceutical Preparations
|
2.20102
|
-1.09
|
-0.30
|
3.42
|
|
(L). Manufacture of Rubber and Plastic Products
|
2.71467
|
1.05
|
-0.10
|
11.43
|
|
(M). Manufacture of Other Non-Metallic Mineral Products
|
2.84074
|
-3.72
|
1.57
|
2.57
|
|
(N). Manufacture of Basic Metals
|
8.41133
|
-2.00
|
-1.29
|
13.41
|
|
(O). Manufacture of Fabricated Metal Products, except Machinery and Equipment
|
4.13294
|
-0.50
|
-0.10
|
6.83
|
|
(P). Manufacture of Computer, Electronic and Optical Products
|
2.07628
|
-1.12
|
5.85
|
0.19
|
|
(Q). Manufacture of Electrical Equipment
|
2.64318
|
1.49
|
1.86
|
10.96
|
|
(R). Manufacture of Machinery and Equipment n.e.c.
|
3.46796
|
0.39
|
0.98
|
2.42
|
|
(S). Manufacture of Motor Vehicles, Trailers and Semi-Trailers
|
5.43645
|
1.73
|
-0.28
|
3.03
|
|
(T). Manufacture of Other Transport Equipment
|
1.39511
|
-0.30
|
2.08
|
4.16
|
|
(U). Manufacture of Furniture
|
0.82618
|
0.10
|
-0.79
|
4.86
|
|
(V). Other Manufacturing
|
2.03798
|
6.42
|
16.47
|
20.17
|
|
FOOD INDEX
|
24.99851
|
7.28
|
-1.87
|
6.37
|
ऑक्टोबर 2026 महिन्यासाठी उत्पादन उत्पादक किंमत निर्देशांकाची तात्पुरती आकडेवारी (आधार वर्ष 2022-23)
1. ऑक्टोबर 2026 मधल्या उत्पादन उत्पादक किंमत निर्देशांकाची ठळक वैशिष्ट्ये
1. ऑक्टोबर 2026 मध्ये सर्व वस्तूंचा संपूर्ण भारताचा उत्पादन उत्पादक किंमत निर्देशांक 113.3 होता, तर सप्टेंबर 2026 मध्ये तो 112.5 होता.
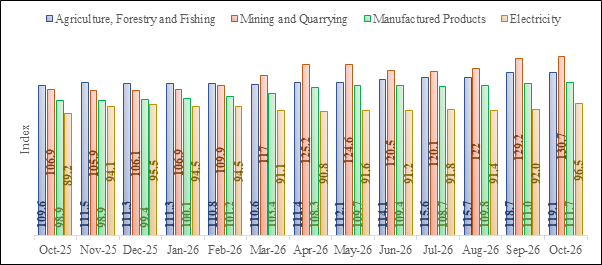
2. ऑक्टोबर 2026 मध्ये कृषी, वनीकरण आणि मत्स्यव्यवसाय, खाणकाम आणि उत्खनन, उत्पादित वस्तू आणि वीज या क्षेत्रांचे उत्पादन उत्पादक किंमत निर्देशांक अनुक्रमे 119.1, 130.7, 111.7 आणि 96.5 होते. सप्टेंबर 2026 मध्ये हे निर्देशांक अनुक्रमे 118.7, 129.2, 111.0 आणि 92.0 होते.
3. गेल्या 13 महिन्यांतल्या सर्व वस्तू आणि प्रमुख गटांचे मासिक निर्देशांक खालील आलेखांमध्ये दिले आहेत.
Chart 5: Output PPI for All Commodities
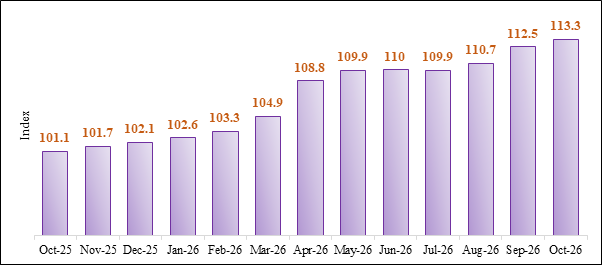
Chart 6: Output PPI across Major Groups
2.
ऑगस्ट 2026 महिन्यासाठी उत्पादन उत्पादक किंमत निर्देशांकाचा अंतिम आकडा तात्पुरत्या 110.8 वरून सुधारुन 110.7 करण्यात आला आहे.
3.
गेल्या सहा महिन्यांतल्या सर्व वस्तू, प्रमुख गट आणि उपगटांचे उत्पादन उत्पादक किंमत निर्देशांक परिशिष्ट-V मध्ये दिले आहेत.
4.
आर्थिक वर्ष 2023-24, 2024-25, 2025-26 आणि 2026-27 या वर्षांमध्ये एप्रिल ते ऑक्टोबर या कालावधीतल्या सर्व वस्तू, प्रमुख गट आणि उपगटांचे संचयी उत्पादन उत्पादक किंमत निर्देशांक परिशिष्ट-VI मध्ये दिले आहेत.
5.
एप्रिल 2023 ते ऑक्टोबर 2026 या कालावधीतील उत्पादन उत्पादक किंमत निर्देशांकाच्या (आधार वर्ष 2022-23) मालिकेतील पुरवठा-वापर तक्त्यानुसार (SUT) वर्गनिहाय आकडेवारी https://eaindustry.nic.in/download_data_2223.asp या संकेतस्थळावर उपलब्ध आहे.
ऑक्टोबर 2026 महिन्यासाठी प्रायोगिक निविष्ठा उत्पादक किंमत निर्देशांकाची तात्पुरती आकडेवारी (आधार वर्ष 2022-23)
1. ऑक्टोबर 2026 मध्ये उत्पादन क्षेत्रासाठीचा संपूर्ण भारताचा प्रायोगिक निविष्ठा उत्पादक किंमत निर्देशांक 108.2 इतका नोंदवण्यात आला आहे. ही तात्पुरती आकडेवारी आहे.
2. ऑगस्ट 2026 महिन्यासाठी उत्पादन क्षेत्राचा प्रायोगिक निविष्ठा उत्पादक किंमत निर्देशांक तात्पुरत्या 104.2 वरून सुधारित करून अंतिम आकडेवारीनुसार 105.1 करण्यात आला आहे.
3. मे ते ऑक्टोबर 2026 या कालावधीतील राष्ट्रीय औद्योगिक वर्गीकरणाच्या (NIC) दोन अंकी स्तरावरील सर्व उत्पादन उद्योगांचा प्रायोगिक निविष्ठा उत्पादक किंमत निर्देशांक खाली दिला आहे.
Annexure-V
Output PPI for All Commodities, Major Groups and Groups for last six months
|
Groups/Major Groups
|
Weight
|
May-26
(F)
|
Jun-26
(F)
|
Jul-26
(F)
|
Aug-26
(F)
|
Sep-26
(P)
|
Oct-26
(P)
|
|
ALL COMMODITIES
|
100.00000
|
109.9
|
110.0
|
109.9
|
110.7
|
112.5
|
113.3
|
|
AGRICULTURE, FORESTRY AND FISHING
|
22.15648
|
112.1
|
114.1
|
115.6
|
115.7
|
118.7
|
119.1
|
|
Crop and Animal Production, Hunting and Related Service Activities
|
19.03219
|
111.9
|
114.2
|
116.1
|
116.3
|
119.9
|
120.2
|
|
Forestry and Logging
|
1.67481
|
118.8
|
119.6
|
119.9
|
119.9
|
120.9
|
121.3
|
|
Fishing and Aquaculture
|
1.44948
|
106.9
|
106.6
|
103.7
|
102.9
|
100.0
|
102.5
|
|
MINING AND QUARRYING
|
3.42065
|
124.6
|
120.5
|
120.1
|
122.0
|
129.2
|
130.7
|
|
Mining of Metal Ores
|
0.70792
|
180.1
|
179.5
|
177.6
|
179.3
|
182.2
|
180.4
|
|
Mining of Coal and Lignite
|
0.7398
|
86.6
|
87.9
|
88.4
|
90.5
|
95.1
|
96.9
|
|
Other Mining and Quarrying
|
1.23208
|
108.5
|
110.0
|
112.7
|
111.3
|
111.4
|
110.9
|
|
Extraction of Crude Petroleum and Natural Gas
|
0.74085
|
136.2
|
114.2
|
108.9
|
116.3
|
142.2
|
149.9
|
|
MANUFACTURED PRODUCTS
|
69.93568
|
109.7
|
109.4
|
108.7
|
109.8
|
111.0
|
111.7
|
|
(A). Manufacture of Food Products
|
8.47196
|
112.5
|
113.7
|
115.4
|
117.1
|
117.7
|
117.8
|
|
(B). Manufacture of Beverages
|
0.8417
|
105.0
|
105.2
|
104.7
|
105.4
|
106.0
|
106.2
|
|
(C). Manufacture of Tobacco Products
|
0.25705
|
125.6
|
128.3
|
128.4
|
128.4
|
127.1
|
128.5
|
|
(D). Manufacture of Textiles
|
4.38774
|
103.9
|
105.3
|
105.7
|
106.0
|
108.0
|
107.9
|
|
(E). Manufacture of Wearing Apparel
|
1.20494
|
110.8
|
111.0
|
110.9
|
111.2
|
112.0
|
111.8
|
|
(F). Manufacture of Leather and Related Products
|
0.49989
|
107.1
|
107.4
|
107.1
|
107.0
|
107.4
|
107.4
|
|
(G). Manufacture of Wood and Products of Wood and Cork, except Furniture; Manufacture of Articles of Straw and Plaiting Materials
|
1.08949
|
113.2
|
113.6
|
113.9
|
113.7
|
113.6
|
113.8
|
|
(H). Manufacture of Paper and Paper Products
|
1.03128
|
94.5
|
94.1
|
94.8
|
95.3
|
96.4
|
97.5
|
|
(I). Printing and Reproduction of Recorded Media
|
0.30931
|
109.5
|
109.5
|
109.6
|
109.6
|
110.6
|
110.0
|
|
(J). Manufacture of Coke and Refined Petroleum Products
|
7.14818
|
125.2
|
122.3
|
112.7
|
117.8
|
118.8
|
124.2
|
|
(K). Manufacture of Chemicals and Chemical Products
|
5.74793
|
104.1
|
104.3
|
103.1
|
104.4
|
106.3
|
106.8
|
|
(L). Manufacture of Basic Pharmaceuticals, Medicinal Chemical and Botanical Products
|
1.92807
|
103.6
|
103.7
|
104.2
|
103.7
|
104.7
|
103.9
|
|
(M). Manufacture of Rubber and Plastic Products
|
2.57252
|
107.0
|
107.4
|
107.3
|
107.8
|
109.5
|
109.9
|
|
(N). Manufacture of Other Non-Metallic Mineral Products
|
2.50437
|
99.1
|
99.8
|
100.1
|
99.8
|
100.4
|
100.2
|
|
(O). Manufacture of Basic Metals
|
7.465
|
104.3
|
101.0
|
101.8
|
102.4
|
105.7
|
106.6
|
|
(P). Manufacture of Fabricated Metal Products, except Machinery and Equipment
|
3.15198
|
103.3
|
103.3
|
103.9
|
104.1
|
104.9
|
105.0
|
|
(Q). Manufacture of Computer, Electronic and Optical Products
|
1.7748
|
104.9
|
104.7
|
105.0
|
105.5
|
105.8
|
106.0
|
|
(R). Manufacture of Electrical Equipment
|
3.81453
|
107.2
|
107.9
|
108.3
|
108.8
|
109.6
|
109.4
|
|
(S). Manufacture of Machinery and Equipment n.e.c.
|
2.46158
|
105.7
|
105.6
|
106.4
|
106.3
|
106.9
|
106.9
|
|
(T). Manufacture of Motor Vehicles, Trailers and Semi-Trailers
|
4.39321
|
107.2
|
108.5
|
108.9
|
109.4
|
109.9
|
110.2
|
|
(U). Manufacture of Other Transport Equipment
|
1.34392
|
107.6
|
108.5
|
109.3
|
109.4
|
110.2
|
110.0
|
|
(V). Manufacture of Furniture
|
0.73566
|
104.9
|
104.7
|
104.8
|
104.6
|
105.0
|
105.7
|
|
(W). Other Manufacturing
|
6.80057
|
122.2
|
121.5
|
120.7
|
121.0
|
122.8
|
121.7
|
|
ELECTRICITY
|
4.48719
|
91.6
|
91.2
|
91.8
|
91.4
|
92.0
|
96.5
|
|
Electricity
|
4.48719
|
91.6
|
91.2
|
91.8
|
91.4
|
92.0
|
96.5
|
(P)-Provisional, (F)-Final
Annexure-VI
Cumulative Output PPI for All Commodities, Major Groups and Groups
|
Groups/Major Groups
|
Weight
|
Apr-Oct
FY 2023-24
|
Apr-Oct
FY 2024-25
|
Apr-Oct
FY 2025-26
|
Apr-Oct
FY 2026-27
|
|
ALL COMMODITIES
|
100.00000
|
99.1
|
100.6
|
100.6
|
110.7
|
|
AGRICULTURE, FORESTRY AND FISHING
|
22.15648
|
105.5
|
111.2
|
108.1
|
115.2
|
|
Crop and Animal Production, Hunting and Related Service Activities
|
19.03219
|
105.8
|
111.7
|
108.3
|
115.7
|
|
Forestry and Logging
|
1.67481
|
103.8
|
113.5
|
111.8
|
119.6
|
|
Fishing and Aquaculture
|
1.44948
|
102.8
|
101.7
|
100.8
|
103.7
|
|
MINING AND QUARRYING
|
3.42065
|
99.2
|
105.6
|
105.0
|
124.6
|
|
Mining of Metal Ores
|
0.70792
|
103.5
|
124.6
|
144.2
|
179.1
|
|
Mining of Coal and Lignite
|
0.7398
|
92.8
|
90.0
|
88.5
|
90.4
|
|
Other Mining and Quarrying
|
1.23208
|
103.2
|
110.4
|
105.2
|
110.7
|
|
Extraction of Crude Petroleum and Natural Gas
|
0.74085
|
94.9
|
95.1
|
83.6
|
129.8
|
|
MANUFACTURED PRODUCTS
|
69.93568
|
97.4
|
97.5
|
98.6
|
109.8
|
|
(A). Manufacture of Food Products
|
8.47196
|
97.7
|
101.3
|
106.5
|
115.0
|
|
(B). Manufacture of Beverages
|
0.8417
|
102.4
|
104.0
|
104.1
|
105.3
|
|
(C). Manufacture of Tobacco Products
|
0.25705
|
104.3
|
106.9
|
109.8
|
127.4
|
|
(D). Manufacture of Textiles
|
4.38774
|
92.9
|
92.8
|
92.6
|
105.4
|
|
(E). Manufacture of Wearing Apparel
|
1.20494
|
102.1
|
104.1
|
107.6
|
111.1
|
|
(F). Manufacture of Leather and Related Products
|
0.49989
|
101.0
|
101.1
|
103.0
|
107.0
|
|
(G). Manufacture of Wood and Products of Wood and Cork, except Furniture; Manufacture of Articles of Straw and Plaiting Materials
|
1.08949
|
102.0
|
103.2
|
106.7
|
113.6
|
|
(H). Manufacture of Paper and Paper Products
|
1.03128
|
90.3
|
90.3
|
91.3
|
95.2
|
|
(I). Printing and Reproduction of Recorded Media
|
0.30931
|
104.3
|
104.8
|
105.7
|
109.7
|
|
(J). Manufacture of Coke and Refined Petroleum Products
|
7.14818
|
90.7
|
89.1
|
85.1
|
120.3
|
|
(K). Manufacture of Chemicals and Chemical Products
|
5.74793
|
93.0
|
91.4
|
91.1
|
104.6
|
|
(L). Manufacture of Basic Pharmaceuticals, Medicinal Chemical and Botanical Products
|
1.92807
|
101.5
|
99.3
|
100.2
|
103.9
|
|
(M). Manufacture of Rubber and Plastic Products
|
2.57252
|
95.4
|
96.3
|
96.3
|
107.9
|
|
(N). Manufacture of Other Non-Metallic Mineral Products
|
2.50437
|
99.2
|
95.5
|
96.7
|
99.8
|
|
(O). Manufacture of Basic Metals
|
7.465
|
94.6
|
92.9
|
91.0
|
103.5
|
|
(P). Manufacture of Fabricated Metal Products, except Machinery and Equipment
|
3.15198
|
98.8
|
99.1
|
98.3
|
103.8
|
|
(Q). Manufacture of Computer, Electronic and Optical Products
|
1.7748
|
98.2
|
97.1
|
106.4
|
105.2
|
|
(R). Manufacture of Electrical Equipment
|
3.81453
|
99.4
|
99.6
|
101.0
|
108.1
|
|
(S). Manufacture of Machinery and Equipment n.e.c.
|
2.46158
|
102.1
|
102.6
|
103.5
|
106.2
|
|
(T). Manufacture of Motor Vehicles, Trailers and Semi-Trailers
|
4.39321
|
104.4
|
106.1
|
105.9
|
108.8
|
|
(U). Manufacture of Other Transport Equipment
|
1.34392
|
101.8
|
101.5
|
104.1
|
108.9
|
|
(V). Manufacture of Furniture
|
0.73566
|
101.5
|
101.3
|
101.4
|
105.0
|
|
(W). Other Manufacturing
|
6.80057
|
101.3
|
102.6
|
108.2
|
121.5
|
|
ELECTRICITY
|
4.48719
|
94.9
|
93.1
|
91.9
|
92.2
|
|
Electricity
|
4.48719
|
94.9
|
93.1
|
91.9
|
92.2
|
Note: Cumulative Index has been calculated by taking Arithmetic Mean of 7 months indices
Provisional Trial Input Producer Price Index (IPPI) (Base Year 2022-23) for the month of October 2026
- All India trial Input PPI for Manufacturing Sector for October 2026 stands at 108.2 (Provisional).
- Trial Input PPI for Manufacturing Sector for the month of August 2026 has been revised from 104.2 (provisional) to 105.1 (final).
- Trial Input PPI for all Manufacturing Industries at NIC-2-digit, from May to October 2026 is given below.
Trial Input PPI for all Manufacturing Industries at NIC-2-digit
|
Industry Group
|
Weight
|
May-26
(F)
|
Jun-26
(F)
|
Jul-26
(F)
|
Aug-26
(F)
|
Sep-26
(P)
|
Oct-26
(P)
|
|
Manufacturing Sector
|
100.000000
|
106.5
|
105.9
|
105.5
|
105.1
|
106.1
|
108.2
|
|
(A). Manufacture of Food Products
|
14.84638
|
110.5
|
112.1
|
113.5
|
114.6
|
115.3
|
116.4
|
|
(B). Manufacture of Beverages
|
1.03035
|
105.4
|
105.5
|
106.5
|
107.7
|
108.8
|
110.1
|
|
(C). Manufacture of Tobacco Products
|
0.26443
|
122.5
|
123.5
|
125.7
|
125.2
|
125.8
|
126.8
|
|
(D). Manufacture of Textiles
|
5.88918
|
103.4
|
103.8
|
104.0
|
104.1
|
104.9
|
105.8
|
|
(E). Manufacture of Wearing Apparel
|
1.57012
|
107.4
|
108.3
|
107.9
|
108.4
|
109.4
|
110.0
|
|
(F). Manufacture of Leather and Related Products
|
0.77634
|
97.9
|
97.1
|
98.6
|
98.2
|
99
|
98.7
|
|
(G). Manufacture of Wood and Products of Wood and Cork, Except Furniture; Manufacture of Articles of Straw and Plaiting Materials
|
1.82194
|
113.4
|
111.5
|
110.5
|
110.8
|
111.8
|
112.1
|
|
(H). Manufacture of Paper and Paper Products
|
0.87494
|
97.2
|
97.4
|
98.1
|
98.7
|
99.8
|
101.2
|
|
(I). Printing and Reproduction of Recorded Media
|
0.46606
|
98.9
|
98.8
|
99.1
|
99.1
|
97.6
|
99.0
|
|
(J). Manufacture of Coke and Refined Petroleum Products
|
12.3291
|
111.8
|
105.1
|
100.6
|
93.8
|
94.7
|
103.1
|
|
(K). Manufacture of Chemicals and Chemical Products
|
7.98919
|
110.5
|
110.7
|
109.9
|
110.8
|
113.4
|
114.5
|
|
(L). Manufacture of Basic Pharmaceutical Products and Pharmaceutical Preparations
|
2.40463
|
105.3
|
104.7
|
105.0
|
106.1
|
107.3
|
109.3
|
|
(M). Manufacture of Rubber and Plastic Products
|
3.40235
|
111.1
|
112.8
|
111.9
|
113.8
|
115.5
|
117.6
|
|
(N). Manufacture of Other Non-Metallic Mineral Products
|
3.28306
|
98.4
|
96.4
|
93.1
|
93.3
|
95.8
|
97.0
|
|
(O). Manufacture of Basic Metals
|
11.25229
|
102.2
|
101.6
|
101.6
|
102.0
|
103.4
|
104.8
|
|
(P). Manufacture of Fabricated Metal Products, except Machinery and Equipment
|
5.59239
|
104.7
|
105.7
|
105.7
|
105.8
|
106.9
|
108.1
|
|
(Q). Manufacture of Computer, Electronic and Optical Products
|
2.22964
|
107.0
|
108.9
|
109.8
|
108.7
|
108.8
|
109.3
|
|
(R). Manufacture of Electrical Equipment
|
3.64437
|
116.2
|
117.5
|
117.6
|
118.6
|
120.2
|
121.0
|
|
(S). Manufacture of Machinery and Equipment n.e.c.
|
5.07784
|
105.4
|
105.0
|
105.2
|
105.2
|
104.5
|
106.7
|
|
(T). Manufacture of Motor Vehicles, Trailers and Semi-Trailers, and Manufacture of Other Transport Equipment
|
10.49446
|
103.7
|
104.0
|
104.8
|
105.1
|
106.3
|
106.8
|
|
(U). Manufacture of Furniture
|
0.98353
|
100.7
|
100.5
|
101.9
|
101.2
|
102
|
102.8
|
|
(V). Other Manufacturing
|
3.77741
|
89.5
|
87.3
|
87.7
|
86.8
|
86.2
|
89.0
|
(P)-Provisional, (F)-Final
नितीन फुल्लुके/निखिलेश चित्रे/प्रिती मालंडकर
सोशल मिडियावर आम्हाला फॉलो करा: @PIBMumbai
 /PIBMumbai
 /pibmumbai
 pibmumbai[at]gmail[dot]com
 /PIBMumbai
 /pibmumbai