Ministry of Science & Technology
100 Years of solar data traces new clues on how the Sun’s surface tracks its 11-Year Activity Cycle
प्रविष्टि तिथि:
05 JUN 2026 3:54PM by PIB Delhi
The Kodaikanal solar observatory, known for the oldest continuous series of solar data collected in India, have helped uncover how giant convection patterns on the Sun respond to solar activity, providing insights for future solar cycle prediction.
Much like a boiling pot of water on a stove, the energy generated within the Sun is transported through its outer layers via convection. Convective cells lead to the formation of small-scale granulations and large scale supergranulations as a network structure on the solar surface.
The network cells have an average lifetime of 24 hr, and a size of about 30,000 km., The width of the cooler intergranular lanes is about 6000 km. What is the origin of these supergranulations, what determines their size, and what is their relation with the 11-year solar cycle continue to be a puzzle. A recent study from the Indian Institute of Astrophysics based on more than 100 years of data from the Kodaikanal Solar Observatory sheds some light on these questions.
This observed network arises due to magnetic flux concentration at cell boundaries as a consequence of supergranular convection. Skylab observations in the 1970s have shown that the chromospheric network extends to the transition region as the Extreme UltraViolet (EUV) network. The network is dominant in the midtransition region, and it disintegrates in the corona.
Scientists from Indian Institute of Astrophysics (IIA), an autonomous institute of the Department of Science and Technology (DST) examined the relationship between the solar cycle and two physical quantities like lane widths and intensities.
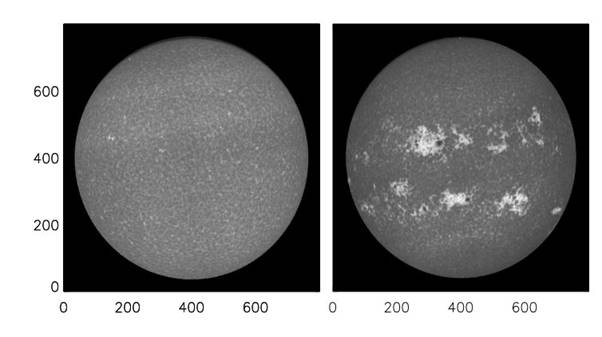
Fig: Ca II K spectroheliograms from Kodaikanal Solar Observatory. The image on the left is taken during the solar minimum year of 1913, and the one on the right is taken during the solar maximum year of 1917.
To see how the time lag between the quantities varies in different latitudes, the researchers led by Prof KP Raju examined the cross-correlation between these quantities to see where the correlation coefficient reaches a maximum.
With Lane widths and intensities at different latitudes from the Ca II K spectroheliograms from the 100-year Kodaikanal archival data from 1907, the study published in the Astrophysical Journal Letters, analyzed 34,000 Ca II K images and found that lane widths and intensities correlate strongly with sunspot numbers, peaking around +/-(11–22)° latitude. The peak correlation for lane widths occurs at (18 +/- 2)°N and (20 +/- 2)°S, while for intensities, it is at (13 +/- 2)°N and (14 +/- 2)°S, indicating no unique latitude follows the solar cycle for all quantities. Lane width correlations peak during solar maximum, whereas intensity correlations peak 1.25–1.5 years after solar maximum, suggesting a time lag in their responses to solar activity. The study finds that the lag varies with latitude: zero near ±20°, decreasing towards higher latitudes, and increasing towards the equator. For lane widths, the lag ranges from 0.5 to 0.8 years, while for intensities, it varies from 0.3 to about 2.5 years, indicating significant differences in their temporal behavior.
“Our findings suggest that supergranular properties, such as lane width and intensity, are influenced by local magnetic flux and solar activity levels. The study highlights the importance of understanding these correlations for predicting solar activity and its effects on solar irradiance variations, particularly in the UV spectrum”, explained KP Raju. The results contribute to ongoing discussions about the origins of supergranulation and its role in magnetic flux transport on the solar surface.
The analysis confirms that while no single latitude follows the solar cycle exactly, significant correlations exist at specific latitudes for different quantities. Future research is needed to further explore the mechanisms behind the observed behaviors and their implications for solar dynamics and irradiance variations. The archival data from Kodaikanal provide valuable information on more than nine solar cycles. The NLST with its high-resolution capabilities will also make significant contributions to supergranular dynamics.
Publication Link: https://ui.adsabs.harvard.edu/abs/2025ApJ...991L..26R/
******
NKR/FT/NM
(रिलीज़ आईडी: 2269299)
आगंतुक पटल : 2189