सांख्यिकी आणि कार्यक्रम अंमलबजावणी मंत्रालय
ऑक्टोबर 2025 महिन्यासाठी ग्रामीण,शहरी आणि संयुक्त साठी आधार वर्ष 2012 = 100 नुसार ग्राहक मूल्य निर्देशांक
प्रविष्टि तिथि:
12 NOV 2025 7:26PM by PIB Mumbai
नवी दिल्ली, 12 नोव्हेंबर 2025
I.ठळक वैशिष्ट्ये :
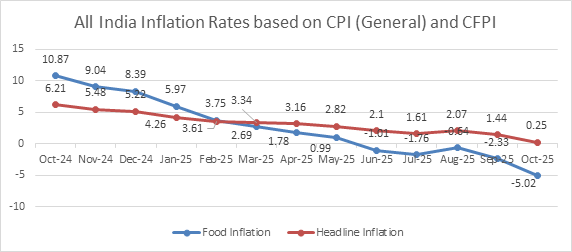
- ऑक्टोबर 2025 मध्ये प्रमुख चलनवाढीचा दर 0.25 % पर्यंत घसरला.
- या महिन्यात अन्नधान्य चलनवाढीचा दर -5.02 % पर्यंत घसरला
- सर्व क्षेत्रांवर जीएसटीमधील कपातीचा परिणाम दिसून येतो
प्रमुख चलनवाढ:
ऑक्टोबर 2025 या महिन्यासाठी अखिल भारतीय ग्राहक किंमत निर्देशांकावर आधारित वर्ष-दर-वर्ष चलनवाढीचा दर ऑक्टोबर 2024 च्या तुलनेत 0.25%(तात्पुरता) आहे. सप्टेंबर 2025 च्या तुलनेत ऑक्टोबर 2025 च्या प्रमुख चलनवाढीत 119 बेसिस पॉइंट्सची घट झाली आहे. ही सध्याच्या सीपीआय मालिकेतील सर्वात कमी वार्षिक चलनवाढ आहे.
खाद्यान्न चलनवाढ: ऑक्टोबर 2024 च्या तुलनेत ऑक्टोबर 2025 महिन्यात अखिल भारतीय ग्राहक अन्न किंमत निर्देशांकावर आधारित वार्षिक चलनवाढीचा दर -5.02% (तात्पुरता) आहे. ग्रामीण आणि शहरी भागांसाठी संबंधित चलनवाढीचा दर अनुक्रमे –4.85% आणि -5.18%, आहे. गेल्या 13 महिन्यांतील सीपीआय (सामान्य) आणि सीएफपीआयसाठी अखिल भारतीय चलनवाढीचा दर खाली दिला आहे. सप्टेंबर 2025 च्या तुलनेत ऑक्टोबर 2025 मध्ये खाद्यान्न महागाईत 269 बेसिस पॉइंट्सची घट दिसून आली आहे. ऑक्टोबर 2025 मधील खाद्यान्न महागाई ही सध्याच्या सीपीआय मालिकेतील सर्वात कमी आहे.
ऑक्टोबर 2025 मध्ये महागाई आणि खाद्यान्न महागाईत झालेली घट प्रामुख्याने जीएसटी दरात झालेल्या कपातीचा संपूर्ण महिन्याचा परिणाम, अनुकूल आधार परिणाम आणि तेल आणि चरबी, भाज्या, फळे, अंडी, पादत्राणे, तृणधान्ये आणि उत्पादने, वाहतूक आणि दळणवळण इत्यादींच्या महागाईत घट झाल्यामुळे झाली आहे.
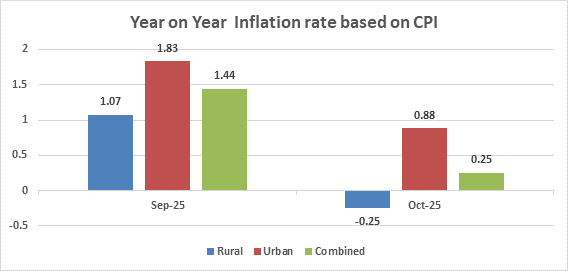
ग्रामीण महागाई दर: ऑक्टोबर 2025 मध्ये ग्रामीण क्षेत्रातील प्रमुख आणि अन्न महागाईत घट दिसून आली. ऑक्टोबर 2025 मध्ये प्रमुख महागाई दर -0.25% (तात्पुरती) राहिला तर सप्टेंबर 2025 मध्ये तो-1.07% होता. ग्रामीण क्षेत्रातील ग्राहक खाद्यान्न किंमत निर्देशांकावर आधारित खाद्यान्न महागाई दर ऑक्टोबर 2025 मध्ये -4.85% (तात्पुरता) दिसून आला , जो सप्टेंबर 2025 मध्ये -2.22% होता.
शहरी महागाई दर: शहरी क्षेत्रातील प्रमुख महागाईमध्ये सप्टेंबर 2025 मधील 1.83%च्या तुलनेत ऑक्टोबर 2025 मध्ये 0.88% (तात्पुरता ) पर्यंत घट दिसून आली आहे. खाद्यान्न महागाईमध्ये सप्टेंबर 2025 मधील -2.47% च्या तुलनेत ऑक्टोबर 2025 मध्ये -5.18% (तात्पुरती) पर्यंत घट दिसून आली आहे.
गृहनिर्माण क्षेत्रातील महागाई दर: ऑक्टोबर 2025 मध्ये वार्षिक आधारावर गृहनिर्माण महागाई दर 2.96%(तात्पुरता) राहिला . सप्टेंबर 2025 मध्ये संबंधित महागाई दर 2.98% होता. गृहनिर्माण निर्देशांक केवळ शहरी क्षेत्रासाठी संकलित केला आहे.
शिक्षण महागाई दर: ऑक्टोबर 2025 मध्ये वार्षिक आधारावर शैक्षणिक महागाई दर 3.49% (तात्पुरता) राहिला . सप्टेंबर 2025 मध्ये संबंधित महागाई दर 3.44% होता. ग्रामीण आणि शहरी दोन्ही क्षेत्रांसाठी हा एकत्रित शैक्षणिक महागाई दर आहे.
आरोग्य महागाई दर: ऑक्टोबर 2025 मध्ये वार्षिक आरोग्य महागाई दर 3.86% (तात्पुरता) आहे. सप्टेंबर 2025 मध्ये संबंधित महागाई दर 4.39% होता. ग्रामीण आणि शहरी दोन्ही क्षेत्रांसाठी हा एकत्रित आरोग्य महागाई दर आहे.
वाहतूक आणि दळणवळण: ऑक्टोबर 2025 मध्ये वार्षिक वाहतूक आणि दळणवळण महागाई दर 0.94% (तात्पुरता) राहिला. सप्टेंबर 2025 मध्ये संबंधित महागाई दर 1.82% होता. ग्रामीण आणि शहरी दोन्ही क्षेत्रांसाठी हा एकत्रित महागाई दर आहे.
इंधन आणि वीज: ऑक्टोबर 2025 मध्ये वार्षिक इंधन आणि वीज महागाई दर 1.98% (तात्पुरता) आहे. सप्टेंबर 2025 मध्ये तो 1.98% होता. ग्रामीण आणि शहरी दोन्ही क्षेत्रांसाठी हा एकत्रित महागाई दर आहे.
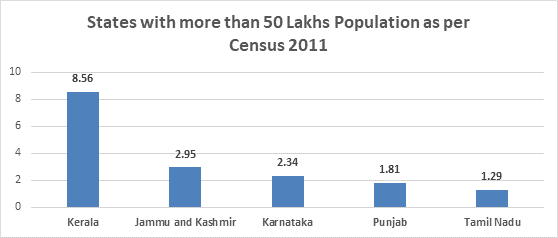
ऑक्टोबर 2025 मध्ये वार्षिक महागाई दर सर्वाधिक असलेली पाच प्रमुख राज्ये खालील आलेखात दाखवली आहेत.
II. सामान्य निर्देशांक आणि सीएफपीआय वर आधारित अखिल भारतीय महागाई दर (पॉइंट-टू-पॉइंट आधारावर म्हणजेच गेल्या वर्षीच्या त्याच महिन्याच्या तुलनेत, चालू महिन्यात म्हणजेच ऑक्टोबर 2024 च्या तुलनेत ऑक्टोबर 2025 मध्ये ), खालीलप्रमाणे दिले आहेत:
ऑक्टोबर 2025 (तात्पुरते), सप्टेंबर 2025 (अंतिम) आणि ऑक्टोबर 2024 या महिन्यांसाठी अखिल भारतीय सीपीआय (सामान्य), सीएफपीआय आणि संबंधित महागाई दर (%)
|
|
October, 2025 (Prov.)
|
September, 2025 (Final)
|
October, 2024
|
|
Rural
|
Urban
|
Combd.
|
Rural
|
Urban
|
Combd.
|
Rural
|
Urban
|
Combd.
|
|
Inflation
|
CPI (General)
|
-0.25
|
0.88
|
0.25
|
1.07
|
1.83
|
1.44
|
6.68
|
5.62
|
6.21
|
|
CFPI
|
-4.85
|
-5.18
|
-5.02
|
-2.22
|
-2.47
|
-2.33
|
10.69
|
11.09
|
10.87
|
|
Index
|
CPI (General)
|
199.0
|
195.4
|
197.3
|
198.8
|
194.9
|
197.0
|
199.5
|
193.7
|
196.8
|
|
CFPI
|
198.1
|
205.1
|
200.5
|
198.5
|
205.7
|
201.0
|
208.2
|
216.3
|
211.1
|
टीप: Prov. – तात्पुरता, Combd. – एकत्रित
III. Monthly changes in the General Indices and CFPIs are given below:
Monthly changes (%) in All India CPI (General) and CFPI: October, 2025 over September, 2025
|
Indices
|
October, 2025 (Prov.)
|
September, 2025 (Final)
|
Monthly change (%)
|
|
Rural
|
Urban
|
Combd.
|
Rural
|
Urban
|
Combd.
|
Rural
|
Urban
|
Combd.
|
|
CPI (General)
|
199.0
|
195.4
|
197.3
|
198.8
|
194.9
|
197.0
|
0.10
|
0.26
|
0.15
|
|
CFPI
|
198.1
|
205.1
|
200.5
|
198.5
|
205.7
|
201.0
|
-0.20
|
-0.29
|
-0.25
|
IV. प्रतिसाद दर - एनएसओ अर्थात राष्ट्रीय सांख्यिकी कार्यालयाच्या क्षेत्रीय विभागाच्या कर्मचाऱ्यांद्वारे देशातली सर्व राज्ये आणि केंद्रशासित प्रदेशांमधील 1114 शहरी बाजारपेठा व 1181 गावे यांतून किंमतींविषयी माहिती गोळा केली जाते. ऑक्टोबर 2025 मध्ये एनएसओने 100% गावे व 98.6% शहरी बाजारांतून किंमती गोळा केल्या; ग्रामीण बाजारासाठी नोंदविलेल्या किंमती 88.53% व शहरीसाठी 92.17% होत्या.
V. नोव्हेंबर 2025 च्या सीपीआयच्या प्रसिद्धीची तारीख 12 डिसेंबर 2025 (शुक्रवार) किंवा 12 तारखेला सुट्टी असल्यास पुढील कामकाजाचा दिवस आहे. अधिक माहितीसाठी www.cpi.mospi.gov.in किंवा esankhyiki.mospi.gov.in या संकेतस्थळांना भेट द्या.
List of Annexures
|
Annex
|
Title
|
|
I
|
All-India General, Group and Sub-group level CPI and CFPI numbers for September, 2025 (Final) and October, 2025 (Provisional) for Rural, Urban and Combined (Annexure I)
|
|
II
|
All-India inflation rates (%) for General, Group and Sub-group level CPI and CFPI numbers for October, 2025 (Provisional) for Rural, Urban and Combined (Annexure II)
|
|
III
|
General CPI for States for Rural, Urban and Combined for September, 2025 (Final) and October, 2025 (Provisional) (Annexure III)
|
|
IV
|
Year-on-year inflation rates (%) of major States for Rural, Urban and Combined for October, 2025 (Provisional) (Annexure IV)
|
|
V
|
Year-on-year Inflation rate (%) of key items for September, 2025 (Final) and October, 2025 (Provisional) (Base: 2012=100) (Annexure V)
|
|
VI
|
Time Series Data for All India General CPI (Base 2012 =100) Since January, 2013 (Annexure VI)
|
|
VII
|
Time Series Data for All India Year-on-year inflation rates (%) based on General CPI (Base 2012=100) Since January, 2014 (Annexure VII)
|
For more details, please visit the website www.cpi.mospi.gov.in or esankhyiki.mospi.gov.in or scan the QR code below:

Annexure I
All-India General, Group and Sub-group level CPI and CFPI numbers for September, 2025 (Final) and October, 2025 (Provisional) for Rural, Urban and Combined (Base: 2012=100)
|
Group Code
|
Sub-group Code
|
Description
|
Rural
|
Urban
|
Combined
|
|
Weights
|
September
25
Index
(Final)
|
October 25
Index
(Prov.)
|
Weights
|
September
25
Index
(Final)
|
October25
Index
(Prov.)
|
Weights
|
September
25
Index
(Final)
|
October 25 Index
(Prov.)
|
|
(1)
|
(2)
|
(3)
|
(4)
|
(5)
|
(6)
|
(7)
|
(8)
|
(9)
|
(10)
|
(11)
|
(12)
|
|
|
1.1.01
|
Cereals and products
|
12.35
|
197.6
|
197.2
|
6.59
|
198.1
|
197.9
|
9.67
|
197.8
|
197.4
|
|
|
1.1.02
|
Meat and fish
|
4.38
|
223.9
|
224.3
|
2.73
|
236.1
|
236.5
|
3.61
|
228.2
|
228.6
|
|
|
1.1.03
|
Egg
|
0.49
|
195.6
|
196.6
|
0.36
|
200.4
|
201.8
|
0.43
|
197.5
|
198.6
|
|
|
1.1.04
|
Milk and products
|
7.72
|
191.0
|
190.8
|
5.33
|
192.9
|
193.3
|
6.61
|
191.7
|
191.7
|
|
|
1.1.05
|
Oils and fats
|
4.21
|
203.4
|
202.4
|
2.81
|
185.3
|
185.0
|
3.56
|
196.8
|
196.0
|
|
|
1.1.06
|
Fruits
|
2.88
|
209.4
|
208.4
|
2.90
|
211.0
|
205.9
|
2.89
|
210.1
|
207.2
|
|
|
1.1.07
|
Vegetables
|
7.46
|
197.3
|
196.7
|
4.41
|
240.9
|
240.2
|
6.04
|
212.1
|
211.5
|
|
|
1.1.08
|
Pulses and products
|
2.95
|
181.6
|
180.4
|
1.73
|
185.4
|
184.3
|
2.38
|
182.9
|
181.7
|
|
|
1.1.09
|
Sugar and Confectionery
|
1.70
|
136.3
|
136.8
|
0.97
|
137.8
|
138.0
|
1.36
|
136.8
|
137.2
|
|
|
1.1.10
|
Spices
|
3.11
|
221.9
|
221.3
|
1.79
|
219.3
|
219.3
|
2.50
|
221.0
|
220.6
|
|
|
1.2.11
|
Non-alcoholic beverages
|
1.37
|
191.7
|
191.2
|
1.13
|
180.8
|
180.9
|
1.26
|
187.1
|
186.9
|
|
|
1.1.12
|
Prepared meals, snacks, sweets etc.
|
5.56
|
206.8
|
207.2
|
5.54
|
218.4
|
218.8
|
5.55
|
212.2
|
212.6
|
|
1
|
|
Food and beverages
|
54.18
|
199.2
|
198.8
|
36.29
|
206.8
|
206.4
|
45.86
|
202.0
|
201.6
|
|
2
|
|
Pan, tobacco and intoxicants
|
3.26
|
212.7
|
213.5
|
1.36
|
218.7
|
219.3
|
2.38
|
214.3
|
215.0
|
|
|
3.1.01
|
Clothing
|
6.32
|
202.8
|
202.6
|
4.72
|
193.7
|
193.5
|
5.58
|
199.2
|
199.0
|
|
|
3.1.02
|
Footwear
|
1.04
|
195.6
|
194.0
|
0.85
|
178.1
|
175.7
|
0.95
|
188.3
|
186.4
|
|
3
|
|
Clothing and footwear
|
7.36
|
201.8
|
201.4
|
5.57
|
191.3
|
190.8
|
6.53
|
197.6
|
197.2
|
|
4
|
|
Housing
|
-
|
-
|
-
|
21.67
|
186.4
|
188.1
|
10.07
|
186.4
|
188.1
|
|
5
|
|
Fuel and light
|
7.94
|
184.2
|
183.8
|
5.58
|
174.3
|
174.5
|
6.84
|
180.4
|
180.3
|
|
|
6.1.01
|
Household goods and services
|
3.75
|
188.9
|
189.0
|
3.87
|
181.9
|
182.4
|
3.80
|
185.6
|
185.9
|
|
|
6.1.02
|
Health
|
6.83
|
206.7
|
206.3
|
4.81
|
201.1
|
200.9
|
5.89
|
204.6
|
204.3
|
|
|
6.1.03
|
Transport and communication
|
7.60
|
179.6
|
178.2
|
9.73
|
168.2
|
166.9
|
8.59
|
173.6
|
172.3
|
|
|
6.1.04
|
Recreation and amusement
|
1.37
|
183.4
|
182.9
|
2.04
|
179.0
|
178.7
|
1.68
|
180.9
|
180.5
|
|
|
6.1.05
|
Education
|
3.46
|
197.5
|
197.6
|
5.62
|
194.3
|
194.7
|
4.46
|
195.6
|
195.9
|
|
|
6.1.06
|
Personal care and effects
|
4.25
|
240.8
|
254.9
|
3.47
|
242.3
|
255.7
|
3.89
|
241.4
|
255.2
|
|
6
|
|
Miscellaneous
|
27.26
|
199.7
|
201.4
|
29.53
|
189.8
|
191.0
|
28.32
|
194.9
|
196.4
|
|
General Index (All Groups)
|
100.00
|
198.8
|
199.0
|
100.00
|
194.9
|
195.4
|
100.00
|
197.0
|
197.3
|
|
Consumer Food Price Index (CFPI)
|
47.25
|
198.5
|
198.1
|
29.62
|
205.7
|
205.1
|
39.06
|
201.0
|
200.5
|
Notes:
-
Prov. : Provisional.
-
CFPI : Out of 12 sub-groups contained in ‘Food and Beverages’ group, CFPI is based on ten sub-groups, excluding ‘Non-alcoholic beverages’ and ‘Prepared meals, snacks, sweets etc.’.
3- : CPI (Rural) for housing is not compiled.
Annexure II
All-India year-on-year inflation rates (%) for General, Group and Sub-group level CPI and CFPI numbers for October, 2025 (Provisional) for Rural, Urban and Combined (Base: 2012=100)
|
Group Code
|
Sub-group Code
|
Description
|
Rural
|
Urban
|
Combined
|
|
October 24 Index
(Final)
|
October 25
Index
(Prov.)
|
Inflation Rate
(%)
|
October 24 Index
(Final)
|
October 25
Index
(Prov.)
|
Inflation Rate
(%)
|
October 24 Index
(Final)
|
October 25
Index
(Prov.)
|
Inflation Rate
(%)
|
|
(1)
|
(2)
|
(3)
|
(4)
|
(5)
|
(6)
|
(7)
|
(8)
|
(9)
|
(10)
|
(11)
|
(12)
|
|
|
1.1.01
|
Cereals and products
|
196.3
|
197.2
|
0.46
|
194.1
|
197.9
|
1.96
|
195.6
|
197.4
|
0.92
|
|
|
1.1.02
|
Meat and fish
|
221.6
|
224.3
|
1.22
|
230.5
|
236.5
|
2.60
|
224.7
|
228.6
|
1.74
|
|
|
1.1.03
|
Egg
|
194.1
|
196.6
|
1.29
|
199.0
|
201.8
|
1.41
|
196.0
|
198.6
|
1.33
|
|
|
1.1.04
|
Milk and products
|
186.9
|
190.8
|
2.09
|
187.9
|
193.3
|
2.87
|
187.3
|
191.7
|
2.35
|
|
|
1.1.05
|
Oils and fats
|
181.0
|
202.4
|
11.82
|
168.2
|
185.0
|
9.99
|
176.3
|
196.0
|
11.17
|
|
|
1.1.06
|
Fruits
|
192.5
|
208.4
|
8.26
|
196.1
|
205.9
|
5.00
|
194.2
|
207.2
|
6.69
|
|
|
1.1.07
|
Vegetables
|
270.5
|
196.7
|
-27.28
|
333.9
|
240.2
|
-28.06
|
292.0
|
211.5
|
-27.57
|
|
|
1.1.08
|
Pulses and products
|
215.0
|
180.4
|
-16.09
|
220.1
|
184.3
|
-16.27
|
216.7
|
181.7
|
-16.15
|
|
|
1.1.09
|
Sugar and Confectionery
|
131.3
|
136.8
|
4.19
|
133.0
|
138.0
|
3.76
|
131.9
|
137.2
|
4.02
|
|
|
1.1.10
|
Spices
|
229.7
|
221.3
|
-3.66
|
225.0
|
219.3
|
-2.53
|
228.1
|
220.6
|
-3.29
|
|
|
1.2.11
|
Non-alcoholic beverages
|
185.4
|
191.2
|
3.13
|
174.0
|
180.9
|
3.97
|
180.6
|
186.9
|
3.49
|
|
|
1.1.12
|
Prepared meals, snacks, sweets etc.
|
199.6
|
207.2
|
3.81
|
210.2
|
218.8
|
4.09
|
204.5
|
212.6
|
3.96
|
|
1
|
|
Food and beverages
|
206.7
|
198.8
|
-3.82
|
214.1
|
206.4
|
-3.60
|
209.4
|
201.6
|
-3.72
|
|
2
|
|
Pan, tobacco and intoxicants
|
207.4
|
213.5
|
2.94
|
213.5
|
219.3
|
2.72
|
209.0
|
215.0
|
2.87
|
|
|
3.1.01
|
Clothing
|
199.2
|
202.6
|
1.71
|
189.2
|
193.5
|
2.27
|
195.3
|
199.0
|
1.89
|
|
|
3.1.02
|
Footwear
|
192.9
|
194.0
|
0.57
|
175.2
|
175.7
|
0.29
|
185.5
|
186.4
|
0.49
|
|
3
|
|
Clothing and footwear
|
198.3
|
201.4
|
1.56
|
187.1
|
190.8
|
1.98
|
193.9
|
197.2
|
1.70
|
|
4
|
|
Housing
|
-
|
-
|
-
|
182.7
|
188.1
|
2.96
|
182.7
|
188.1
|
2.96
|
|
5
|
|
Fuel and light
|
181.1
|
183.8
|
1.49
|
169.7
|
174.5
|
2.83
|
176.8
|
180.3
|
1.98
|
|
|
6.1.01
|
Household goods and services
|
185.8
|
189.0
|
1.72
|
177.4
|
182.4
|
2.82
|
181.8
|
185.9
|
2.26
|
|
|
6.1.02
|
Health
|
198.6
|
206.3
|
3.88
|
193.6
|
200.9
|
3.77
|
196.7
|
204.3
|
3.86
|
|
|
6.1.03
|
Transport and communication
|
176.4
|
178.2
|
1.02
|
165.5
|
166.9
|
0.85
|
170.7
|
172.3
|
0.94
|
|
|
6.1.04
|
Recreation and amusement
|
180.4
|
182.9
|
1.39
|
176.0
|
178.7
|
1.53
|
177.9
|
180.5
|
1.46
|
|
|
6.1.05
|
Education
|
191.8
|
197.6
|
3.02
|
187.6
|
194.7
|
3.78
|
189.3
|
195.9
|
3.49
|
|
|
6.1.06
|
Personal care and effects
|
205.1
|
254.9
|
24.28
|
207.3
|
255.7
|
23.35
|
206.0
|
255.2
|
23.88
|
|
6
|
|
Miscellaneous
|
189.9
|
201.4
|
6.06
|
181.5
|
191.0
|
5.23
|
185.8
|
196.4
|
5.71
|
|
General Index (All Groups)
|
199.5
|
199.0
|
-0.25
|
193.7
|
195.4
|
0.88
|
196.8
|
197.3
|
0.25
|
|
Consumer Food Price Index
|
208.2
|
198.1
|
-4.85
|
216.3
|
205.1
|
-5.18
|
211.1
|
200.5
|
-5.02
|
Notes:
-
Prov. : Provisional.
-
- : CPI (Rural) for housing is not compiled.
Annexure III
General CPI for States for Rural, Urban and Combined for September, 2025 (Final) and October, 2025 (Provisional) (Base: 2012=100)
|
Sl. No.
|
Name of the State/UT
|
Rural
|
Urban
|
Combined
|
|
Weights
|
September 25 Index
(Final)
|
October 25 Index
(Prov.)
|
Weights
|
September 25 Index
(Final)
|
October 25 Index
(Prov.)
|
Weights
|
September 25 Index
(Final)
|
October 25 Index
(Prov.)
|
|
(1)
|
(2)
|
(3)
|
(4)
|
(5)
|
(6)
|
(7)
|
(8)
|
(9)
|
(10)
|
(11)
|
|
1
|
Andhra Pradesh
|
5.40
|
200.2
|
201.0
|
3.64
|
202.1
|
203.3
|
4.58
|
200.9
|
201.8
|
|
2
|
Arunachal Pradesh
|
0.14
|
202.6
|
201.9
|
0.06
|
--
|
--
|
0.10
|
202.6
|
201.9
|
|
3
|
Assam
|
2.63
|
195.3
|
196.5
|
0.79
|
197.7
|
198.7
|
1.77
|
195.8
|
197.0
|
|
4
|
Bihar
|
8.21
|
192.5
|
192.9
|
1.62
|
202.0
|
203.1
|
5.14
|
193.9
|
194.4
|
|
5
|
Chhattisgarh
|
1.68
|
192.2
|
192.5
|
1.22
|
185.6
|
185.5
|
1.46
|
189.6
|
189.8
|
|
6
|
Delhi
|
0.28
|
176.4
|
176.1
|
5.64
|
176.0
|
175.6
|
2.77
|
176.0
|
175.6
|
|
7
|
Goa
|
0.14
|
191.6
|
193.6
|
0.25
|
185.1
|
184.3
|
0.19
|
187.6
|
187.9
|
|
8
|
Gujarat
|
4.54
|
194.1
|
193.9
|
6.82
|
184.7
|
184.6
|
5.60
|
188.8
|
188.6
|
|
9
|
Haryana
|
3.30
|
202.2
|
200.0
|
3.35
|
188.7
|
188.6
|
3.32
|
195.9
|
194.7
|
|
10
|
Himachal Pradesh
|
1.03
|
186.9
|
186.9
|
0.26
|
189.6
|
188.6
|
0.67
|
187.4
|
187.2
|
|
11
|
Jharkhand
|
1.96
|
191.9
|
190.9
|
1.39
|
198.5
|
198.2
|
1.69
|
194.4
|
193.7
|
|
12
|
Karnataka
|
5.09
|
202.9
|
204.1
|
6.81
|
206.0
|
206.8
|
5.89
|
204.6
|
205.6
|
|
13
|
Kerala
|
5.50
|
220.0
|
221.8
|
3.46
|
210.1
|
211.2
|
4.55
|
216.5
|
218.1
|
|
14
|
Madhya Pradesh
|
4.93
|
194.0
|
193.6
|
3.97
|
196.0
|
196.5
|
4.48
|
194.8
|
194.8
|
|
15
|
Maharashtra
|
8.25
|
196.1
|
196.9
|
18.86
|
191.0
|
191.9
|
13.18
|
192.7
|
193.6
|
|
16
|
Manipur
|
0.23
|
227.2
|
227.8
|
0.12
|
190.9
|
192.9
|
0.18
|
215.7
|
216.8
|
|
17
|
Meghalaya
|
0.28
|
178.4
|
178.8
|
0.15
|
189.2
|
187.9
|
0.22
|
181.8
|
181.6
|
|
18
|
Mizoram
|
0.07
|
207.3
|
208.0
|
0.13
|
186.4
|
187.8
|
0.10
|
194.5
|
195.7
|
|
19
|
Nagaland
|
0.14
|
205.9
|
206.6
|
0.12
|
190.6
|
190.7
|
0.13
|
199.4
|
199.8
|
|
20
|
Odisha
|
2.93
|
201.4
|
201.4
|
1.31
|
192.2
|
192.7
|
2.18
|
198.8
|
199.0
|
|
21
|
Punjab
|
3.31
|
196.4
|
195.8
|
3.09
|
186.7
|
186.0
|
3.21
|
192.1
|
191.4
|
|
22
|
Rajasthan
|
6.63
|
193.6
|
193.5
|
4.23
|
192.2
|
191.7
|
5.51
|
193.1
|
192.9
|
|
23
|
Sikkim
|
0.06
|
207.0
|
207.0
|
0.03
|
191.8
|
191.8
|
0.05
|
202.0
|
202.0
|
|
24
|
Tamil Nadu
|
5.55
|
204.3
|
204.8
|
9.20
|
203.0
|
204.2
|
7.25
|
203.5
|
204.4
|
|
25
|
Telangana
|
3.16
|
206.8
|
208.0
|
4.41
|
201.2
|
201.9
|
3.74
|
203.7
|
204.7
|
|
26
|
Tripura
|
0.35
|
216.5
|
209.4
|
0.14
|
208.3
|
211.2
|
0.25
|
214.4
|
209.9
|
|
27
|
Uttar Pradesh
|
14.83
|
195.5
|
195.2
|
9.54
|
194.2
|
194.6
|
12.37
|
195.0
|
195.0
|
|
28
|
Uttarakhand
|
1.06
|
191.5
|
191.3
|
0.73
|
199.2
|
200.3
|
0.91
|
194.4
|
194.7
|
|
29
|
West Bengal
|
6.99
|
202.2
|
202.5
|
7.20
|
200.9
|
201.9
|
7.09
|
201.6
|
202.2
|
|
30
|
Andaman & Nicobar Islands
|
0.05
|
205.0
|
206.4
|
0.07
|
193.1
|
195.9
|
0.06
|
198.9
|
201.1
|
|
31
|
Chandigarh
|
0.02
|
197.0
|
194.8
|
0.34
|
183.9
|
182.9
|
0.17
|
184.6
|
183.6
|
|
32
|
Dadra & Nagar Haveli
|
0.02
|
180.3
|
179.4
|
0.04
|
190.4
|
190.8
|
0.03
|
187.0
|
187.0
|
|
33
|
Daman & Diu
|
0.02
|
202.2
|
201.8
|
0.02
|
193.0
|
191.7
|
0.02
|
198.3
|
197.6
|
|
34
|
Jammu & Kashmir*
|
1.14
|
212.4
|
211.8
|
0.72
|
204.2
|
204.4
|
0.94
|
209.5
|
209.2
|
|
35
|
Lakshadweep
|
0.01
|
209.6
|
211.0
|
0.01
|
200.1
|
206.9
|
0.01
|
204.7
|
208.9
|
|
36
|
Puducherry
|
0.08
|
210.6
|
211.2
|
0.27
|
201.3
|
201.2
|
0.17
|
203.7
|
203.8
|
|
All India
|
100.00
|
198.8
|
199.0
|
100.00
|
194.9
|
195.4
|
100.00
|
197.0
|
197.3
|
Notes:
-
Prov.: Provisional
-
--: indicates the receipt of price schedules is less than 80% of allocated schedules and therefore indices are not compiled.
-
*: Figures of this row pertain to the prices and weights of the combined Union Territories of Jammu & Kashmir
and Ladakh (erstwhile State of Jammu & Kashmir).
Annexure IV
Year-on-year inflation rates (%) of major@ States for Rural, Urban and Combined for October, 2025 (Provisional) (Base: 2012=100)
|
Sl. No.
|
Name of the State/UT
|
Rural
|
Urban
|
Combined
|
|
October 24 Index
(Final)
|
October 25
Index
(Prov.)
|
Inflation Rate
(%)
|
October 24 Index
(Final)
|
October 25
Index
(Prov.)
|
Inflation Rate
(%)
|
October 24 Index
(Final)
|
October 25
Index
(Prov.)
|
Inflation Rate
(%)
|
|
(1)
|
(2)
|
(3)
|
(4)
|
(5)
|
(6)
|
(7)
|
(8)
|
(9)
|
(10)
|
(11)
|
|
1
|
Andhra Pradesh
|
201.4
|
201.0
|
-0.20
|
201.2
|
203.3
|
1.04
|
201.3
|
201.8
|
0.25
|
|
2
|
Assam
|
200.8
|
196.5
|
-2.14
|
196.9
|
198.7
|
0.91
|
200.0
|
197.0
|
-1.50
|
|
3
|
Bihar
|
197.4
|
192.9
|
-2.28
|
203.6
|
203.1
|
-0.25
|
198.3
|
194.4
|
-1.97
|
|
4
|
Chhattisgarh
|
194.5
|
192.5
|
-1.03
|
188.3
|
185.5
|
-1.49
|
192.1
|
189.8
|
-1.20
|
|
5
|
Delhi
|
176.7
|
176.1
|
-0.34
|
176.2
|
175.6
|
-0.34
|
176.2
|
175.6
|
-0.34
|
|
6
|
Gujarat
|
194.3
|
193.9
|
-0.21
|
186.1
|
184.6
|
-0.81
|
189.7
|
188.6
|
-0.58
|
|
7
|
Haryana
|
202.6
|
200.0
|
-1.28
|
187.8
|
188.6
|
0.43
|
195.7
|
194.7
|
-0.51
|
|
8
|
Himachal Pradesh
|
184.1
|
186.9
|
1.52
|
188.5
|
188.6
|
0.05
|
184.9
|
187.2
|
1.24
|
|
9
|
Jharkhand
|
193.4
|
190.9
|
-1.29
|
196.9
|
198.2
|
0.66
|
194.7
|
193.7
|
-0.51
|
|
10
|
Karnataka
|
200.0
|
204.1
|
2.05
|
201.7
|
206.8
|
2.53
|
200.9
|
205.6
|
2.34
|
|
11
|
Kerala
|
202.3
|
221.8
|
9.64
|
198.3
|
211.2
|
6.51
|
200.9
|
218.1
|
8.56
|
|
12
|
Madhya Pradesh
|
198.2
|
193.6
|
-2.32
|
197.7
|
196.5
|
-0.61
|
198.0
|
194.8
|
-1.62
|
|
13
|
Maharashtra
|
197.3
|
196.9
|
-0.20
|
189.2
|
191.9
|
1.43
|
191.9
|
193.6
|
0.89
|
|
14
|
Odisha
|
205.2
|
201.4
|
-1.85
|
193.1
|
192.7
|
-0.21
|
201.8
|
199.0
|
-1.39
|
|
15
|
Punjab
|
191.4
|
195.8
|
2.30
|
183.8
|
186.0
|
1.20
|
188.0
|
191.4
|
1.81
|
|
16
|
Rajasthan
|
195.5
|
193.5
|
-1.02
|
193.0
|
191.7
|
-0.67
|
194.6
|
192.9
|
-0.87
|
|
17
|
Tamil Nadu
|
202.8
|
204.8
|
0.99
|
201.1
|
204.2
|
1.54
|
201.8
|
204.4
|
1.29
|
|
18
|
Telangana
|
211.1
|
208.0
|
-1.47
|
203.8
|
201.9
|
-0.93
|
207.1
|
204.7
|
-1.16
|
|
19
|
Uttar Pradesh
|
200.2
|
195.2
|
-2.50
|
195.2
|
194.6
|
-0.31
|
198.4
|
195.0
|
-1.71
|
|
20
|
Uttarakhand
|
190.8
|
191.3
|
0.26
|
196.7
|
200.3
|
1.83
|
193.0
|
194.7
|
0.88
|
|
21
|
West Bengal
|
204.3
|
202.5
|
-0.88
|
198.0
|
201.9
|
1.97
|
201.3
|
202.2
|
0.45
|
|
22
|
Jammu & Kashmir*
|
204.9
|
211.8
|
3.37
|
200.2
|
204.4
|
2.10
|
203.2
|
209.2
|
2.95
|
|
All India
|
199.5
|
199.0
|
-0.25
|
193.7
|
195.4
|
0.88
|
196.8
|
197.3
|
0.25
|
Notes:
-
Prov. : Provisional.
-
* : Figures of this row pertain to the prices and weights of the combined Union Territories of Jammu &Kashmir and Ladakh (erstwhile State of Jammu & Kashmir).
-
@ : States having population more than 50 lakhs as per Population Census 2011.
Annexure V
Year -on-year inflation rate (%) of key items for September, 2025 (Final) and October, 2025 (Provisional) (Base: 2012=100)
|
S.No.
|
Item Description
|
All India (Combined)
|
|
Weights
|
September 24 Index (Final)
|
October 24 Index (Final)
|
September 25 Index (Final)
|
October 25 Index (Prov.)
|
September 25 (Final) Inflation rate (%)
|
October 25 (Prov.) Inflation rate (%)
|
|
(1)
|
(2)
|
(3)
|
(4)
|
(5)
|
(6)
|
(7)
|
(8)
|
(9)
|
|
1
|
Milk: liquid
|
6.42
|
186.9
|
187.2
|
191.7
|
191.7
|
2.57
|
2.40
|
|
2
|
Rice – Other Sources
|
4.38
|
196.5
|
197.8
|
197.4
|
196.7
|
0.46
|
-0.56
|
|
3
|
Wheat/atta – other sources
|
2.56
|
201.9
|
205.4
|
209.3
|
209.6
|
3.67
|
2.04
|
|
4
|
Mustard Oil
|
1.33
|
162.1
|
174.2
|
196.1
|
195.1
|
20.97
|
12.00
|
|
5
|
Fish, Prawn
|
1.27
|
210.6
|
207.0
|
215.4
|
213.2
|
2.28
|
3.00
|
|
6
|
Refined Oil [sunflower, soyabean, saffola, etc.]
|
1.26
|
151.0
|
164.3
|
181.5
|
181.1
|
20.20
|
10.23
|
|
7
|
Chicken
|
1.23
|
218.1
|
224.7
|
217.9
|
220.4
|
-0.09
|
-1.91
|
|
8
|
Sugar - Other Sources
|
1.13
|
126.0
|
126.2
|
131.3
|
131.6
|
4.21
|
4.28
|
|
9
|
Gold
|
1.08
|
244.5
|
256.1
|
359.4
|
404.2
|
46.99
|
57.83
|
|
10
|
Potato
|
0.98
|
278.8
|
279.4
|
174.7
|
177.0
|
-37.34
|
-36.65
|
|
11
|
Tea: leaf
|
0.96
|
183.8
|
184.4
|
189.7
|
189.2
|
3.21
|
2.60
|
|
12
|
Biscuits, Chocolates, etc.
|
0.88
|
159.0
|
159.3
|
166.7
|
165.9
|
4.84
|
4.14
|
|
13
|
Arhar, Tur
|
0.80
|
258.1
|
256.5
|
180.8
|
178.6
|
-29.95
|
-30.37
|
|
14
|
Goat Meat/Mutton
|
0.79
|
246.8
|
248.2
|
257.1
|
258.0
|
4.17
|
3.95
|
|
15
|
Motor cycle, scooter
|
0.79
|
191.5
|
192.0
|
196.8
|
188.0
|
2.77
|
-2.08
|
|
16
|
Onion
|
0.64
|
405.2
|
428.8
|
203.0
|
195.9
|
-49.90
|
-54.31
|
|
17
|
Tomato
|
0.57
|
237.5
|
353.1
|
222.9
|
201.5
|
-6.15
|
-42.93
|
|
18
|
Ghee
|
0.47
|
195.9
|
196.5
|
203.2
|
202.6
|
3.73
|
3.10
|
|
19
|
Apple
|
0.47
|
157.1
|
139.0
|
154.6
|
139.3
|
-1.59
|
0.22
|
|
20
|
Eggs
|
0.43
|
192.2
|
196.0
|
197.5
|
198.6
|
2.76
|
1.33
|
|
21
|
Jeera
|
0.37
|
251.8
|
248.5
|
215.7
|
212.5
|
-14.34
|
-14.49
|
|
22
|
Silver
|
0.11
|
171.5
|
182.5
|
243.5
|
296.3
|
41.98
|
62.36
|
|
23
|
PC/Laptop/other peripherals incl. software
|
0.11
|
154.2
|
154.5
|
156.4
|
155.6
|
1.43
|
0.71
|
|
24
|
Coconut: copra
|
0.10
|
192.2
|
210.6
|
334.2
|
350.1
|
73.88
|
66.24
|
|
25
|
Gram: whole
|
0.09
|
197.6
|
203.3
|
184.8
|
184.4
|
-6.48
|
-9.30
|
|
26
|
Curd
|
0.09
|
189.0
|
189.2
|
193.1
|
193.2
|
2.17
|
2.11
|
|
27
|
Refrigerator
|
0.09
|
151.4
|
151.4
|
152.0
|
149.6
|
0.40
|
-1.19
|
|
28
|
Coconut oil
|
0.08
|
243.6
|
263.3
|
509.3
|
507.3
|
109.07
|
92.67
|
|
29
|
Cashewnut
|
0.08
|
162.1
|
166.9
|
176.7
|
176.8
|
9.01
|
5.93
|
|
30
|
Air fare [normal]: economy class [adult]
|
0.08
|
196.5
|
195.4
|
205.1
|
211.5
|
4.38
|
8.24
|
Note:
-
Prov.: Provisional
Annexure VI
Time Series Data for All India General CPI (Base 2012 =100) Since January, 2013
|
Year
|
Jan
|
Feb
|
Mar
|
Apr
|
May
|
Jun
|
Jul
|
Aug
|
Sep
|
Oct
|
Nov
|
Dec
|
|
2013
|
104.6
|
105.3
|
105.5
|
106.1
|
106.9
|
109.3
|
111.0
|
112.4
|
113.7
|
114.8
|
116.3
|
114.5
|
|
2014
|
113.6
|
113.6
|
114.2
|
115.1
|
115.8
|
116.7
|
119.2
|
120.3
|
120.1
|
120.1
|
120.1
|
119.4
|
|
2015
|
119.5
|
119.7
|
120.2
|
120.7
|
121.6
|
123.0
|
123.6
|
124.8
|
125.4
|
126.1
|
126.6
|
126.1
|
|
2016
|
126.3
|
126.0
|
126.0
|
127.3
|
128.6
|
130.1
|
131.1
|
131.1
|
130.9
|
131.4
|
131.2
|
130.4
|
|
2017
|
130.3
|
130.6
|
130.9
|
131.1
|
131.4
|
132.0
|
134.2
|
135.4
|
135.2
|
136.1
|
137.6
|
137.2
|
|
2018
|
136.9
|
136.4
|
136.5
|
137.1
|
137.8
|
138.5
|
139.8
|
140.4
|
140.2
|
140.7
|
140.8
|
140.1
|
|
2019
|
139.6
|
139.9
|
140.4
|
141.2
|
142.0
|
142.9
|
144.2
|
145.0
|
145.8
|
147.2
|
148.6
|
150.4
|
|
2020
|
150.2
|
149.1
|
148.6
|
151.4
|
150.9
|
151.8
|
153.9
|
154.7
|
156.4
|
158.4
|
158.9
|
157.3
|
|
2021
|
156.3
|
156.6
|
156.8
|
157.8
|
160.4
|
161.3
|
162.5
|
162.9
|
163.2
|
165.5
|
166.7
|
166.2
|
|
2022
|
165.7
|
166.1
|
167.7
|
170.1
|
171.7
|
172.6
|
173.4
|
174.3
|
175.3
|
176.7
|
176.5
|
175.7
|
|
2023
|
176.5
|
176.8
|
177.2
|
178.1
|
179.1
|
181.0
|
186.3
|
186.2
|
184.1
|
185.3
|
186.3
|
185.7
|
|
2024
|
185.5
|
185.8
|
185.8
|
186.7
|
187.7
|
190.2
|
193.0
|
193.0
|
194.2
|
196.8
|
196.5
|
195.4
|
|
2025
|
193.4
|
192.5
|
192.0
|
192.6
|
193.0
|
194.2
|
196.1
|
197.0
|
197.0
|
197.3*
|
|
|
Notes:
-
*: Index Value for October 2025 is Provisional.
Annexure VII
Time Series Data for All India Year-on-year inflation rates (%) based on General CPI (Base 2012=100) Since January, 2014
|
Year
|
Jan
|
Feb
|
Mar
|
Apr
|
May
|
Jun
|
Jul
|
Aug
|
Sep
|
Oct
|
Nov
|
Dec
|
|
2014
|
8.60
|
7.88
|
8.25
|
8.48
|
8.33
|
6.77
|
7.39
|
7.03
|
5.63
|
4.62
|
3.27
|
4.28
|
|
2015
|
5.19
|
5.37
|
5.25
|
4.87
|
5.01
|
5.40
|
3.69
|
3.74
|
4.41
|
5.00
|
5.41
|
5.61
|
|
2016
|
5.69
|
5.26
|
4.83
|
5.47
|
5.76
|
5.77
|
6.07
|
5.05
|
4.39
|
4.20
|
3.63
|
3.41
|
|
2017
|
3.17
|
3.65
|
3.89
|
2.99
|
2.18
|
1.46
|
2.36
|
3.28
|
3.28
|
3.58
|
4.88
|
5.21
|
|
2018
|
5.07
|
4.44
|
4.28
|
4.58
|
4.87
|
4.92
|
4.17
|
3.69
|
3.70
|
3.38
|
2.33
|
2.11
|
|
2019
|
1.97
|
2.57
|
2.86
|
2.99
|
3.05
|
3.18
|
3.15
|
3.28
|
3.99
|
4.62
|
5.54
|
7.35
|
|
2020
|
7.59
|
6.58
|
5.84
|
-
|
-
|
6.23
|
6.73
|
6.69
|
7.27
|
7.61
|
6.93
|
4.59
|
|
2021
|
4.06
|
5.03
|
5.52
|
4.23
|
6.30
|
6.26
|
5.59
|
5.30
|
4.35
|
4.48
|
4.91
|
5.66
|
|
2022
|
6.01
|
6.07
|
6.95
|
7.79
|
7.04
|
7.01
|
6.71
|
7.00
|
7.41
|
6.77
|
5.88
|
5.72
|
|
2023
|
6.52
|
6.44
|
5.66
|
4.70
|
4.31
|
4.87
|
7.44
|
6.83
|
5.02
|
4.87
|
5.55
|
5.69
|
|
2024
|
5.10
|
5.09
|
4.85
|
4.83
|
4.80
|
5.08
|
3.60
|
3.65
|
5.49
|
6.21
|
5.48
|
5.22
|
|
2025
|
4.26
|
3.61
|
3.34
|
3.16
|
2.82
|
2.10
|
1.61
|
2.07
|
1.44
|
0.25*
|
|
|
Notes:
-
*: Inflation Value for October 2025 is Provisional.
-
-: Inflation was not compiled and released due to Covid-19 pandemic outbreak.
Click here to see in PDF
* * *
शैलेश पाटील/सुषमा काणे/दर्शना राणे
सोशल मिडियावर आम्हाला फॉलो करा: @PIBMumbai
  /PIBMumbai
  /pibmumbai
  pibmumbai[at]gmail[dot]com
  /PIBMumbai
  /pibmumbai
(रिलीज़ आईडी: 2189373)
आगंतुक पटल : 103