सांख्यिकी आणि कार्यक्रम अंमलबजावणी मंत्रालय
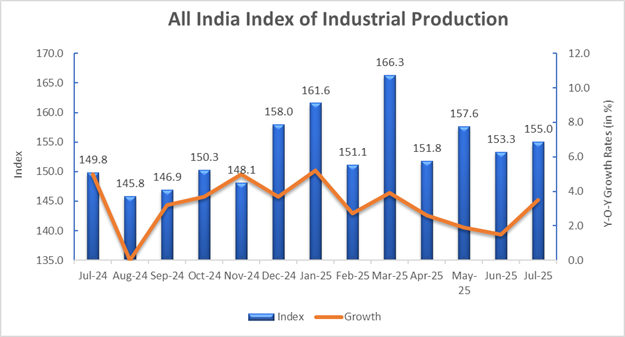
भारताच्या औद्योगिक उत्पादन निर्देशांकात जुलै 2025 मध्ये 3.5 टक्के वाढ
प्रविष्टि तिथि:
28 AUG 2025 5:08PM by PIB Mumbai
नवी दिल्ली, 28 ऑगस्ट 2025
सुधारित दिनदर्शिकेनुसार औद्योगिक उत्पादन निर्देशांकाचा (आयआयपी) जलद अंदाज प्रत्येक महिन्याच्या 28 तारखेला (किंवा त्या दिवशी सुट्टी असल्यास पुढील कामकाजाच्या दिवशी) प्रसिद्ध केला जातो. या जलद अंदाजांचे पुनरावलोकन औद्योगिक उत्पादन निर्देशांकाच्या पुनरावलोकन धोरणानुसार पुढील प्रसिद्धीमध्ये केले जाईल.
ठळक बाबी :
i. जुलै 2025 साठी औद्योगिक उत्पादन निर्देशांक वाढीचा दर 3.5 टक्के नोंदवला गेला . जून 2025 मध्ये हा वृद्धीदर 1.5 टक्के इतका होता.
ii. जुलै 2025 मधील खाणकाम, उत्पादन व वीज या तीन क्षेत्रांचे वृद्धीदर अनुक्रमे (-) 7.2 टक्के, 5.4 टक्के व 0.6 टक्के आहेत.
iii. जुलै 2025 साठीआयआयपीचा जलद अंदाज 155.0 इतका असून, जुलै 2024 मधील 149.8 च्या तुलनेत अधिक आहे. जुलै 2025 साठी खाणकाम, उत्पादन आणि वीज क्षेत्रांचे औद्योगिक उत्पादन निर्देशांक अनुक्रमे 107.7, 156.9 आणि 221.5 इतके आहेत.
iv. उत्पादन क्षेत्रात, एनआयसी (2 अंकी स्तरावर) अंतर्गत असलेल्या 23 उद्योगगटांपैकी 14 गटांनी जुलै 2025 मध्ये जुलै 2024 च्या तुलनेत सकारात्मक वाढ नोंदवली आहे.
v. मागील 13 महिन्यांचे औद्योगिक उत्पादन निर्देशांक मासिक निर्देशांक व वृद्धीदर(%) या अनुषंगाने संलग्न विवरणपत्रात दिले आहेत.
अतिरिक्त माहिती :
जुलै 2025 च्या आयआयपीच्या जलद अंदाजासोबत जून 2025 मधील निर्देशांकांचे अंतिम पुनरावलोकन अद्ययावत आकडेवारीनुसार करण्यात आले आहे.
जुलै 2025 साठीचा जलद अंदाज व जून 2025 साठीचा अंतिम पुनरावलोकन हे अनुक्रमे 89.5 टक्के आणि 93.1 टक्के प्रतिसाद दरांवर आधारित आहेत.
जुलै 2025 महिन्याचा औद्योगिक उत्पादन निर्देशांक क्षेत्रीय, एनआयसी -2008 च्या 2 अंकी स्तरावर व वापर-आधारित वर्गीकरणानुसार संलग्न विवरणपत्र (स्टेटमेंट I, II, III) मध्ये देण्यात आला आहे.
ऑगस्ट 2025 साठीचा औद्योगिक उत्पादन निर्देशांक सोमवार, 29 सप्टेंबर 2025 रोजी प्रसिद्ध केला जाईल.
|
STATEMENT I: INDEX OF INDUSTRIAL PRODUCTION - SECTORAL
|
|
(Base: 2011-12=100)
|
|
Month
|
Mining
|
Manufacturing
|
Electricity
|
General
|
|
(14.372472)
|
(77.63321)
|
(7.994318)
|
(100)
|
|
2024-25
|
2025-26
|
2024-25
|
2025-26
|
2024-25
|
2025-26
|
2024-25
|
2025-26
|
|
Apr
|
130.9
|
130.7
|
144.6
|
149.1
|
212.0
|
215.7
|
148.0
|
151.8
|
|
May
|
136.5
|
136.4
|
150.4
|
155.2
|
229.3
|
218.5
|
154.7
|
157.6
|
|
Jun
|
134.9
|
123.2
|
146.6
|
152.0
|
222.8
|
220.1
|
151.0
|
153.3
|
|
Jul*
|
116.1
|
107.7
|
148.8
|
156.9
|
220.2
|
221.5
|
149.8
|
155.0
|
|
Aug
|
107.1
|
|
146.1
|
|
212.3
|
|
145.8
|
|
|
Sep
|
111.7
|
|
147.2
|
|
206.9
|
|
146.9
|
|
|
Oct
|
128.5
|
|
148.4
|
|
207.8
|
|
150.3
|
|
|
Nov
|
133.8
|
|
147.0
|
|
184.1
|
|
148.1
|
|
|
Dec
|
143.2
|
|
157.2
|
|
192.8
|
|
158.0
|
|
|
Jan
|
150.7
|
|
159.5
|
|
201.9
|
|
161.6
|
|
|
Feb
|
141.9
|
|
148.4
|
|
194.0
|
|
151.1
|
|
|
Mar
|
158.1
|
|
162.4
|
|
219.5
|
|
166.3
|
|
|
Average
|
|
|
|
|
|
|
|
|
|
Apr-Jul
|
129.6
|
124.5
|
147.6
|
153.3
|
221.1
|
219.0
|
150.9
|
154.4
|
|
Growth over the corresponding period of previous year
|
|
|
|
|
|
Jun
|
10.3
|
-8.7
|
3.5
|
3.7
|
8.6
|
-1.2
|
4.9
|
1.5
|
|
Jul*
|
3.8
|
-7.2
|
4.7
|
5.4
|
7.9
|
0.6
|
5.0
|
3.5
|
|
Apr-Jul
|
6.9
|
-3.9
|
4.4
|
3.9
|
10.1
|
-0.9
|
5.4
|
2.3
|
|
*Figures for July 2025 are Quick Estimates.
|
|
Note : Indices for the months of Jun’25 incorporate updated production data.
|
|
STATEMENT II: INDEX OF INDUSTRIAL PRODUCTION - (2-DIGIT LEVEL)
|
|
(Base: 2011-12=100)
|
|
Industry
|
Description
|
Weight
|
Index
|
Cumulative Index
|
Percentage growth
|
|
code
|
|
|
Jul'24
|
Jul'25*
|
Apr-Jul
|
Jul'25*
|
Apr-Jul
|
|
|
|
|
|
|
2024-25
|
2025-26
|
|
2025-26
|
|
10
|
Manufacture of food products
|
5.302
|
119.9
|
118.4
|
118.6
|
119.1
|
-1.3
|
0.4
|
|
11
|
Manufacture of beverages
|
1.035
|
112.9
|
105.8
|
124.6
|
118.7
|
-6.3
|
-4.7
|
|
12
|
Manufacture of tobacco products
|
0.798
|
81.3
|
90.1
|
78.4
|
86.0
|
10.8
|
9.7
|
|
13
|
Manufacture of textiles
|
3.291
|
109.1
|
107.6
|
106.9
|
106.2
|
-1.4
|
-0.7
|
|
14
|
Manufacture of wearing apparel
|
1.322
|
111.7
|
115.3
|
115.8
|
120.9
|
3.2
|
4.4
|
|
15
|
Manufacture of leather and related products
|
0.502
|
102.0
|
98.9
|
98.3
|
95.4
|
-3.0
|
-3.0
|
|
16
|
Manufacture of wood and products of wood and cork, except furniture; manufacture of articles of straw and plaiting materials
|
0.193
|
99.1
|
116.2
|
96.9
|
107.0
|
17.3
|
10.4
|
|
17
|
Manufacture of paper and paper products
|
0.872
|
81.7
|
79.4
|
79.5
|
77.0
|
-2.8
|
-3.1
|
|
18
|
Printing and reproduction of recorded media
|
0.680
|
84.4
|
75.4
|
85.9
|
76.1
|
-10.7
|
-11.4
|
|
19
|
Manufacture of coke and refined petroleum products
|
11.775
|
140.9
|
142.4
|
137.3
|
138.8
|
1.1
|
1.1
|
|
20
|
Manufacture of chemicals and chemical products
|
7.873
|
135.2
|
132.6
|
131.8
|
127.2
|
-1.9
|
-3.5
|
|
21
|
Manufacture of pharmaceuticals, medicinal chemical and botanical products
|
4.981
|
224.7
|
232.9
|
233.2
|
232.2
|
3.6
|
-0.4
|
|
22
|
Manufacture of rubber and plastics products
|
2.422
|
116.9
|
113.4
|
113.2
|
116.7
|
-3.0
|
3.1
|
|
23
|
Manufacture of other non-metallic mineral products
|
4.085
|
136.3
|
149.2
|
147.1
|
156.0
|
9.5
|
6.1
|
|
24
|
Manufacture of basic metals
|
12.804
|
223.7
|
252.1
|
222.4
|
242.7
|
12.7
|
9.1
|
|
25
|
Manufacture of fabricated metal products, except machinery and equipment
|
2.655
|
93.7
|
103.1
|
91.5
|
99.4
|
10.0
|
8.6
|
|
26
|
Manufacture of computer, electronic and optical products
|
1.570
|
130.9
|
136.3
|
129.1
|
131.7
|
4.1
|
2.0
|
|
27
|
Manufacture of electrical equipment
|
2.998
|
131.8
|
152.8
|
125.4
|
138.5
|
15.9
|
10.4
|
|
28
|
Manufacture of machinery and equipment n.e.c.
|
4.765
|
126.2
|
133.7
|
119.4
|
128.7
|
5.9
|
7.8
|
|
29
|
Manufacture of motor vehicles, trailers and semi-trailers
|
4.857
|
133.5
|
143.2
|
130.8
|
141.7
|
7.3
|
8.3
|
|
30
|
Manufacture of other transport equipment
|
1.776
|
155.0
|
172.8
|
150.5
|
157.3
|
11.5
|
4.5
|
|
31
|
Manufacture of furniture
|
0.131
|
209.2
|
223.0
|
223.3
|
229.5
|
6.6
|
2.8
|
|
32
|
Other manufacturing
|
0.941
|
83.3
|
71.4
|
81.7
|
67.9
|
-14.3
|
-16.9
|
|
|
|
|
|
|
|
|
|
|
|
05
|
Mining
|
14.3725
|
116.1
|
107.7
|
129.6
|
124.5
|
-7.2
|
-3.9
|
|
10-32
|
Manufacturing
|
77.6332
|
148.8
|
156.9
|
147.6
|
153.3
|
5.4
|
3.9
|
|
35
|
Electricity
|
7.9943
|
220.2
|
221.5
|
221.1
|
219.0
|
0.6
|
-0.9
|
|
|
|
|
|
|
|
|
|
|
|
|
General Index
|
100.00
|
149.8
|
155.0
|
150.9
|
154.4
|
3.5
|
2.3
|
|
*Figures for July 2025 are Quick Estimates.
|
|
STATEMENT III: INDEX OF INDUSTRIAL PRODUCTION - USE-BASED
|
|
(Base :2011-12=100)
|
|
|
Primary goods
|
Capital goods
|
Intermediate goods
|
Infrastructure/ construction goods
|
Consumer durables
|
Consumer non-durables
|
|
|
Month
|
(34.048612)
|
(8.223043)
|
(17.221487)
|
(12.338363)
|
(12.839296)
|
(15.329199)
|
|
|
|
2024-25
|
2025-26
|
2024-25
|
2025-26
|
2024-25
|
2025-26
|
2024-25
|
2025-26
|
2024-25
|
2025-26
|
2024-25
|
2025-26
|
|
|
Apr
|
152.2
|
151.9
|
95.0
|
108.3
|
157.8
|
165.5
|
184.2
|
192.9
|
119.5
|
126.9
|
150.9
|
146.9
|
|
|
May
|
160.9
|
158.6
|
105.3
|
119.3
|
162.4
|
170.0
|
186.3
|
198.8
|
130.2
|
129.0
|
154.0
|
152.5
|
|
|
Jun
|
156.0
|
152.1
|
111.3
|
114.6
|
159.1
|
167.8
|
184.9
|
197.3
|
127.1
|
130.7
|
145.2
|
143.9
|
|
|
Jul*
|
150.1
|
147.6
|
114.0
|
119.7
|
164.6
|
174.1
|
179.7
|
201.0
|
126.6
|
136.3
|
147.1
|
147.8
|
|
|
Aug
|
141.6
|
|
107.4
|
|
162.3
|
|
181.5
|
|
129.8
|
|
141.8
|
|
|
|
Sep
|
141.3
|
|
116.5
|
|
160.8
|
|
178.8
|
|
132.9
|
|
145.7
|
|
|
|
Oct
|
149.8
|
|
109.2
|
|
165.0
|
|
184.2
|
|
129.8
|
|
146.4
|
|
|
|
Nov
|
147.7
|
|
106.7
|
|
158.5
|
|
177.3
|
|
121.5
|
|
158.1
|
|
|
|
Dec
|
157.7
|
|
114.7
|
|
170.1
|
|
195.4
|
|
123.8
|
|
166.9
|
|
|
|
Jan
|
162.8
|
|
119.3
|
|
172.5
|
|
200.2
|
|
130.0
|
|
165.1
|
|
|
|
Feb
|
152.3
|
|
115.4
|
|
159.1
|
|
191.7
|
|
126.4
|
|
146.7
|
|
|
|
Mar
|
169.5
|
|
136.3
|
|
175.6
|
|
214.6
|
|
138.8
|
|
149.0
|
|
|
|
Average
|
|
|
|
|
|
|
|
|
|
|
|
|
|
|
Apr-Jul
|
154.8
|
152.6
|
106.4
|
115.5
|
161.0
|
169.4
|
183.8
|
197.5
|
125.9
|
130.7
|
149.3
|
147.8
|
|
|
Growth over the corresponding period of previous year
|
|
|
|
|
|
|
|
|
|
Jun
|
6.3
|
-2.5
|
3.6
|
3.0
|
3.2
|
5.5
|
8.2
|
6.7
|
8.8
|
2.8
|
-1.0
|
-0.9
|
|
|
Jul*
|
5.9
|
-1.7
|
11.7
|
5.0
|
7.0
|
5.8
|
5.5
|
11.9
|
8.2
|
7.7
|
-4.2
|
0.5
|
|
|
Apr-Jul
|
6.6
|
-1.4
|
5.2
|
8.6
|
4.4
|
5.2
|
7.4
|
7.5
|
10.1
|
3.8
|
-1.3
|
-1.0
|
|
|
*Figures for July 2025 are Quick Estimates.
|
|
|
|
|
|
|
|
|
|
|
|
NOTE: Indices for the months of Jun'25 incorporate updated production data.
|
| |
|
|
|
|
|
|
|
|
|
|
|
|
|
|
|
STATEMENT IV: MONTHLY INDEX OF INDUSTRIAL PRODUCTION - (2-DIGIT LEVEL)
|
|
(Base: 2011-12=100)
|
|
Industry code
|
Description
|
Weight
|
Jul-24
|
Aug-24
|
Sep-24
|
Oct-24
|
Nov-24
|
Dec-24
|
Jan-25
|
Feb-25
|
Mar-25
|
Apr-25
|
May-25
|
Jun-25
|
Jul-25
|
|
10
|
Manufacture of food products
|
5.3025
|
119.9
|
122.3
|
120.5
|
130.5
|
136.5
|
154.2
|
159.2
|
142.7
|
131.6
|
121.1
|
118.4
|
118.5
|
118.4
|
|
11
|
Manufacture of beverages
|
1.0354
|
112.9
|
100.3
|
101.8
|
102.7
|
99.4
|
104.2
|
117.1
|
116.9
|
133.4
|
121.9
|
131.4
|
115.7
|
105.8
|
|
12
|
Manufacture of tobacco products
|
0.7985
|
81.3
|
78.5
|
91.2
|
92.3
|
80.3
|
88.2
|
96.9
|
76.3
|
96.9
|
75.7
|
93.1
|
85.1
|
90.1
|
|
13
|
Manufacture of textiles
|
3.2913
|
109.1
|
109.4
|
109.3
|
111.1
|
106.2
|
114.2
|
113.7
|
106.7
|
113.0
|
105.7
|
103.8
|
107.8
|
107.6
|
|
14
|
Manufacture of wearing apparel
|
1.3225
|
111.7
|
112.5
|
103.7
|
104.0
|
110.3
|
119.1
|
121.1
|
121.4
|
144.8
|
114.2
|
126.5
|
127.5
|
115.3
|
|
15
|
Manufacture of leather and related products
|
0.5021
|
102.0
|
94.3
|
89.5
|
87.0
|
76.3
|
89.2
|
93.8
|
88.1
|
88.8
|
88.4
|
97.9
|
96.2
|
98.9
|
|
16
|
Manufacture of wood and products of wood and cork, except furniture; manufacture of articles of straw and plaiting materials
|
0.1930
|
99.1
|
108.1
|
106.7
|
103.2
|
98.2
|
115.0
|
104.4
|
106.8
|
117.2
|
105.0
|
102.4
|
104.4
|
116.2
|
|
17
|
Manufacture of paper and paper products
|
0.8724
|
81.7
|
83.0
|
81.2
|
78.3
|
75.0
|
76.9
|
76.7
|
72.2
|
78.2
|
73.7
|
77.4
|
77.3
|
79.4
|
|
18
|
Printing and reproduction of recorded media
|
0.6798
|
84.4
|
83.3
|
84.7
|
78.0
|
82.6
|
89.9
|
83.3
|
78.9
|
82.2
|
75.3
|
77.1
|
76.7
|
75.4
|
|
19
|
Manufacture of coke and refined petroleum products
|
11.7749
|
140.9
|
130.8
|
128.8
|
132.8
|
135.6
|
147.4
|
146.3
|
131.8
|
146.0
|
132.5
|
142.2
|
138.2
|
142.4
|
|
20
|
Manufacture of chemicals and chemical products
|
7.8730
|
135.2
|
129.5
|
129.4
|
129.4
|
123.2
|
131.0
|
130.7
|
121.9
|
129.8
|
121.8
|
127.9
|
126.6
|
132.6
|
|
21
|
Manufacture of pharmaceuticals, medicinal chemical and botanical products
|
4.9810
|
224.7
|
212.6
|
222.9
|
216.9
|
251.4
|
259.1
|
246.1
|
211.8
|
218.3
|
231.5
|
243.5
|
220.8
|
232.9
|
|
22
|
Manufacture of rubber and plastics products
|
2.4222
|
116.9
|
115.5
|
117.6
|
116.6
|
103.6
|
107.0
|
118.7
|
114.6
|
118.9
|
117.0
|
121.8
|
114.7
|
113.4
|
|
23
|
Manufacture of other non-metallic mineral products
|
4.0853
|
136.3
|
139.8
|
137.6
|
144.3
|
136.7
|
157.7
|
162.3
|
159.8
|
180.2
|
156.7
|
159.4
|
158.7
|
149.2
|
|
24
|
Manufacture of basic metals
|
12.8043
|
223.7
|
225.6
|
219.7
|
228.2
|
222.0
|
236.8
|
242.2
|
224.3
|
252.2
|
235.6
|
243.5
|
239.4
|
252.1
|
|
25
|
Manufacture of fabricated metal products, except machinery and equipment
|
2.6549
|
93.7
|
92.8
|
99.5
|
100.2
|
95.2
|
107.4
|
104.0
|
102.2
|
110.4
|
94.1
|
97.7
|
102.8
|
103.1
|
|
26
|
Manufacture of computer, electronic and optical products
|
1.5704
|
130.9
|
146.6
|
146.7
|
124.2
|
115.9
|
115.1
|
126.0
|
139.9
|
165.2
|
126.3
|
129.8
|
134.4
|
136.3
|
|
27
|
Manufacture of electrical equipment
|
2.9983
|
131.8
|
127.7
|
128.1
|
125.9
|
121.1
|
163.9
|
131.4
|
122.1
|
144.8
|
125.9
|
132.3
|
143.1
|
152.8
|
|
28
|
Manufacture of machinery and equipment n.e.c.
|
4.7653
|
126.2
|
122.9
|
131.7
|
120.2
|
117.7
|
127.5
|
121.7
|
124.4
|
158.3
|
118.3
|
130.6
|
132.0
|
133.7
|
|
29
|
Manufacture of motor vehicles, trailers and semi-trailers
|
4.8573
|
133.5
|
129.2
|
132.6
|
133.4
|
134.4
|
116.0
|
148.3
|
142.0
|
145.3
|
146.7
|
142.7
|
134.0
|
143.2
|
|
30
|
Manufacture of other transport equipment
|
1.7763
|
155.0
|
156.4
|
189.0
|
184.5
|
159.4
|
142.2
|
180.0
|
157.8
|
165.2
|
139.2
|
163.1
|
154.2
|
172.8
|
|
31
|
Manufacture of furniture
|
0.1311
|
209.2
|
226.2
|
246.6
|
211.4
|
201.7
|
239.0
|
212.1
|
233.8
|
239.4
|
223.7
|
232.0
|
239.2
|
223.0
|
|
32
|
Other manufacturing
|
0.9415
|
83.3
|
86.9
|
99.5
|
91.8
|
57.0
|
77.9
|
76.6
|
71.5
|
88.2
|
77.2
|
61.4
|
61.7
|
71.4
|
|
|
|
|
|
|
|
|
|
|
|
|
|
|
|
|
|
|
5
|
Mining
|
14.3725
|
116.1
|
107.1
|
111.7
|
128.5
|
133.8
|
143.2
|
150.7
|
141.9
|
158.1
|
130.7
|
136.4
|
123.2
|
107.7
|
|
10-32
|
Manufacturing
|
77.6332
|
148.8
|
146.1
|
147.2
|
148.4
|
147.0
|
157.2
|
159.5
|
148.4
|
162.4
|
149.1
|
155.2
|
152.0
|
156.9
|
|
35
|
Electricity
|
7.9943
|
220.2
|
212.3
|
206.9
|
207.8
|
184.1
|
192.8
|
201.9
|
194.0
|
219.5
|
215.7
|
218.5
|
220.1
|
221.5
|
|
|
|
|
|
|
|
|
|
|
|
|
|
|
|
|
|
|
|
General Index
|
100
|
149.8
|
145.8
|
146.9
|
150.3
|
148.1
|
158.0
|
161.6
|
151.1
|
166.3
|
151.8
|
157.6
|
153.3
|
155.0
|
|
Note: The figures for July 2025 are provisional
|
|
|
|
|
|
|
|
|
|
|
|
|
|
|
Click here to see pdf
सुषमा काणे/राज दळेकर /प्रिती मालंडकर
सोशल मिडियावर आम्हाला फॉलो करा: @PIBMumbai
  /PIBMumbai
  /pibmumbai
  pibmumbai[at]gmail[dot]com
  /PIBMumbai
  /pibmumbai
सोशल मिडियावर आम्हाला फॉलो करा:@PIBMumbai /PIBMumbai /pibmumbai pibmumbai[at]gmail[dot]com /PIBMumbai /pibmumbai
(रिलीज़ आईडी: 2161584)
आगंतुक पटल : 84