Ministry of Commerce & Industry
INDIA’S FOREIGN TRADE: December 2021
India’s overall exports (Merchandise and Services) in December 2021 up by 25 percent over December 2020 to USD 57.87 Billion; overall imports grow by more than 33 percent to USD 72.35 Billion during the same period
Overall exports during April-December 2021 jump by more than 36 percent over same period in the year 2020 to USD 479.07 Billion; overall imports grew 57.33 percent to USD 547.12 Billion during the same period
Posted On:
14 JAN 2022 12:25PM by PIB Delhi
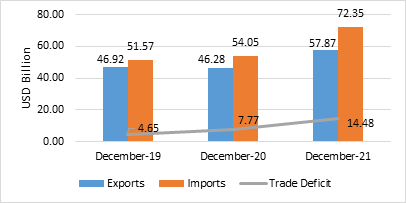
India’s overall exports (Merchandise and Services combined) in December 2021* are estimated to be USD 57.87 Billion, exhibiting a positive growth of 25.05 per cent over the same period last year and a positive growth of 23.35 per cent over December 2019. Overall imports in December 2021* are estimated to be USD 72.35 Billion, exhibiting a positive growth of 33.86 per cent over the same period last year and a positive growth of 40.30 per cent over December 2019
Table 1: Trade during December 2021*
|
|
|
December 2021
(USD Billion)
|
December 2020
(USD Billion)
|
December 2019
(USD Billion)
|
Growth vis-à-vis December 2020 (%)
|
Growth vis-à-vis December 2019 (%)
|
|
Merchandise
|
Exports
|
37.81
|
27.22
|
27.11
|
38.91
|
39.47
|
|
Imports
|
59.48
|
42.93
|
39.59
|
38.55
|
50.24
|
|
Trade Balance
|
-21.68
|
-15.72
|
-12.49
|
-37.92
|
-73.61
|
|
Services*
|
Exports
|
20.07
|
19.06
|
19.81
|
5.26
|
1.29
|
|
Imports
|
12.87
|
11.12
|
11.98
|
15.76
|
7.44
|
|
Net of Services
|
7.20
|
7.95
|
7.84
|
-9.42
|
-8.12
|
|
Overall Trade (Merchandise+
Services)*
|
Exports
|
57.87
|
46.28
|
46.92
|
25.05
|
23.35
|
|
Imports
|
72.35
|
54.05
|
51.57
|
33.86
|
40.30
|
|
Trade Balance
|
-14.48
|
-7.77
|
-4.65
|
-86.32
|
-211.26
|
* Note: The latest data for services sector released by RBI is for November 2021. The data for December 2021 is an estimation, which will be revised based on RBI’s subsequent release. (ii) Data for 2019, 2020 and April to September 2021 are revised on pro-rata basis using quarterly balance of payments data.
Fig 1: Overall Trade during December 2021*
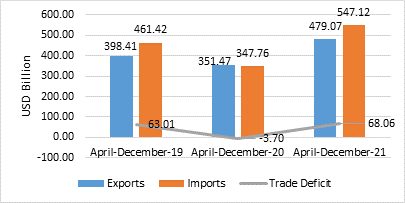
India’s overall exports (Merchandise and Services combined) in April-December 2021* are estimated to be USD 479.07 Billion, exhibiting a positive growth of 36.31 per cent over the same period last year and a positive growth of 20.25 per cent over April-December 2019. Overall imports in April-December 2021* are estimated to be USD 547.12 Billion, exhibiting a positive growth of 57.33 per cent over the same period last year and a positive growth of 18.57 per cent over April-December 2019.
Table 2: Trade during April-December 2021*
|
|
|
April-December 2021
(USD Billion)
|
April-December 2020
(USD Billion)
|
April-December 2019
(USD Billion)
|
Growth vis-à-vis April-December 2020 (%)
|
Growth vis-à-vis April-December 2019 (%)
|
|
Merchandise
|
Exports
|
301.38
|
201.38
|
238.27
|
49.66
|
26.49
|
|
Imports
|
443.82
|
262.76
|
364.18
|
68.91
|
21.87
|
|
Trade Balance
|
-142.44
|
-61.38
|
-125.91
|
-132.07
|
-13.13
|
|
Services*
|
Exports
|
177.68
|
150.09
|
160.13
|
18.39
|
10.96
|
|
Imports
|
103.30
|
85.00
|
97.24
|
21.52
|
6.23
|
|
Net of Services
|
74.39
|
65.08
|
62.90
|
14.30
|
18.27
|
|
Overall Trade (Merchandise+
Services)*
|
Exports
|
479.07
|
351.47
|
398.41
|
36.31
|
20.25
|
|
Imports
|
547.12
|
347.76
|
461.42
|
57.33
|
18.57
|
|
Trade Balance
|
-68.06
|
3.70
|
-63.01
|
-1937.96
|
-8.00
|
* Note: The latest data for services sector released by RBI is for November 2021. The data for December 2021 is an estimation, which will be revised based on RBI’s subsequent release. (ii) Data for 2019, 2020 and April to September 2021 are revised on pro-rata basis using quarterly balance of payments data.
Fig 2: Overall Trade during April-December 2021*
MERCHANDISE TRADE
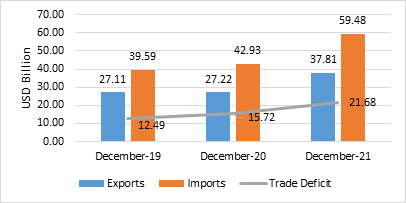
- Merchandise exports in December 2021 were USD 37.81 Billion, as compared to USD 27.22 Billion in December 2020, exhibiting a positive growth of 38.91 per cent. As compared to December 2019, exports in December 2021 exhibited a positive growth of 39.47 per cent.
- Merchandise imports in December 2021 were USD 59.48 Billion, which is an increase of 38.55 per cent over imports of USD 42.93 Billion in December 2020. Imports in December 2021 have registered a positive growth of 50.24 per cent in comparison to December 2019.
- The merchandise trade balance for December 2021 was estimated at USD (-) 21.68 Billion as against USD (-) 15.72 Billion in December 2020, which is a decline of (-) 37.92 per cent. As compared to December 2019 (USD (-) 12.49 Billion), trade balance in December 2021 exhibited a negative growth of (-) 73.61 per cent.
Fig 3: Merchandise Trade during December 2021
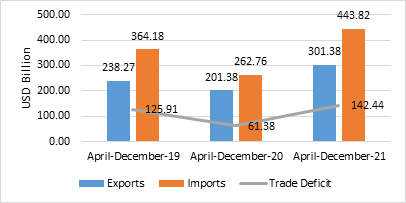
- Merchandise exports for the period April-December 2021 was USD 301.38 Billion as against USD 201.38 Billion during the period April-December 2020, registering a positive growth of 49.66 per cent. As compared to April-December 2019, exports in April-December 2021 exhibited a positive growth of 26.49 per cent.
- Merchandise imports for the period April-December 2021 was USD 443.82 Billion as against USD 262.76 Billion during the period April-December 2020, registering a positive growth of 68.91 per cent. Imports in April-December 2021 have registered a positive growth of 21.87 per cent in comparison to April-December 2019.
- The merchandise trade balance for April-December 2021 was estimated at USD (-) 142.44 Billion as against USD (-) 61.38 Billion in April-December 2020, which is a decline of (-) 132.07 per cent. As compared to April-December 2019 (USD (-) 125.91 Billion), trade balance in April-December 2021 exhibited a negative growth of (-) 13.13 per cent.
Fig 4: Merchandise Trade during April- December 2021
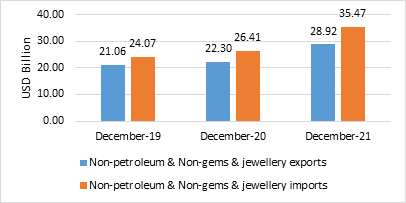
- Non-petroleum and non-gems & jewellery exports in December 2021 were USD 28.92 Billion, registering a positive growth of 29.67 per cent over non-petroleum and non-gems & jewellery exports of USD 22.30 Billion in December 2020 and a positive growth of 37.31 per cent over non-petroleum and non-gems & jewellery exports of USD 21.06 Billion in December 2019.
- Non-petroleum, non-gems & jewellery (gold, silver & precious metals) imports were USD 35.47 Billion in December 2021 with a positive growth of 34.28 per cent over Non-petroleum, non-gems & jewellery imports of USD 26.41 Billion in December 2020 and a positive growth of 47.32 per cent over Non-petroleum, non-gems & jewellery imports of USD 24.07 Billion in December 2019.
Table 3: Trade excluding Petroleum and Gems & Jewellery during December 2021
|
|
December 2021
(USD Billion)
|
December 2020
(USD Billion)
|
December 2019
(USD Billion)
|
Growth vis-à-vis December 2020 (%)
|
Growth vis-à-vis December 2019 (%)
|
|
Non- petroleum exports
|
31.92
|
24.88
|
23.48
|
28.29
|
35.97
|
|
Non- petroleum imports
|
43.32
|
33.31
|
28.88
|
30.07
|
50.02
|
|
Non-petroleum & Non Gems & Jewellery exports
|
28.92
|
22.30
|
21.06
|
29.67
|
37.31
|
|
Non-petroleum & Non Gems & Jewellery imports*
|
35.47
|
26.41
|
24.07
|
34.28
|
47.32
|
Note: Gems & Jewellery Imports include Gold, Silver & Pearls, precious & Semi-precious stones
Fig 5: Trade excluding Petroleum and Gems & Jewellery during December 2021
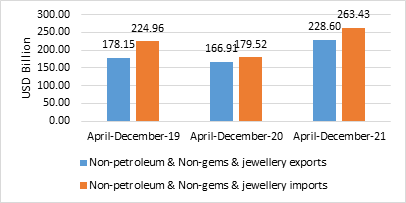
- Non-petroleum and non-gems & jewellery exports during April-December 2021 was USD 228.60 Billion, an increase of 36.96 per cent over non-petroleum and non-gems & jewellery exports of USD 166.91 Billion in April-December 2020 and an increase of 28.32 per cent over non-petroleum and non-gems & jewellery exports of USD 178.15 Billion in April-December 2019.
- Non-petroleum, non-gems & jewellery (gold, silver & precious metals) imports were USD 263.43 Billion in April-December 2021, recording a positive growth of 46.74 per cent, as compared to Non-petroleum, non-gems & jewellery imports of USD 179.52 Billion in April-December 2020 and a positive growth of 17.10 per cent over USD 224.96 Billion in April-December 2019.
Table 4: Trade excluding Petroleum and Gems & Jewellery during April-December 2021
|
|
April-December 2021
(USD Billion)
|
April-December 2020
(USD Billion)
|
April-December 2019
(USD Billion)
|
Growth vis-à-vis April-December 2020 (%)
|
Growth vis-à-vis April-December 2019 (%)
|
|
Non- petroleum exports
|
257.50
|
183.79
|
206.13
|
40.11
|
24.92
|
|
Non- petroleum imports
|
325.56
|
208.80
|
267.47
|
55.92
|
21.72
|
|
Non-petroleum & Non Gems & Jewellery exports
|
228.60
|
166.91
|
178.15
|
36.96
|
28.32
|
|
Non-petroleum & Non Gems & Jewellery imports*
|
263.43
|
179.52
|
224.96
|
46.74
|
17.10
|
Note: Gems & Jewellery Imports include Gold, Silver & Pearls, precious & Semi-precious stones
Fig 6: Trade excluding Petroleum and Gems & Jewellery during April-December 2021
SERVICES TRADE
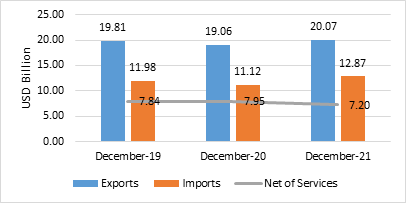
- The estimated value of services export for December 2021* is USD 20.07 Billion, exhibiting a positive growth of 5.26 per cent vis-a-vis December 2020 (USD 19.06 Billion) and a positive growth of 1.29 per cent vis-à-vis December 2019 (USD 19.81 Billion).
- The estimated value of services import for December 2021* is USD 12.87 Billion exhibiting a positive growth of 15.76 per cent vis-à-vis December 2020 (USD 11.12 Billion) and a positive growth of 7.44 per cent vis-à-vis December 2019 (USD 11.98 Billion).
- The services trade balance in December 2021* is estimated at USD 7.20 Billion, which is a decline of (-) 9.42 per cent over December 2020 (USD 7.95 Billion) and a decline of (-) 8.12 per cent over December 2019 (USD 7.84 Billion).
Fig 7: Services Trade during December 2021*
- The estimated value of services export for April-December 2021* is USD 177.68 Billion, exhibiting a positive growth of 18.39 per cent vis-a-vis April-December 2020 (USD 150.09 Billion) and a positive growth of 10.96 per cent vis-à-vis April-December 2019 (USD 160.13 Billion).
- The estimated value of services imports for April-December 2021* is USD 103.30 Billion exhibiting a positive growth of 21.52 per cent vis-à-vis April-December 2020 (USD 85.00 Billion) and a positive growth of 6.23 per cent vis-à-vis April-December 2019 (USD 97.24 Billion).
- The services trade balance for April-December 2021* was estimated at USD 74.39 Billion as against USD 65.08 Billion in April-December 2020, which is an increase of 14.30 per cent. As compared to April-December 2019 (USD 62.90 Billion), net of services in April-December 2021* exhibited a positive growth of 18.27 per cent.
Fig 8: Services Trade during April-December 2021*
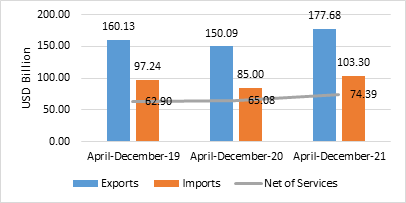
Table 5: Export Growth in Commodity Groups in December 2021
|
Sl. No.
|
Commodities
|
(Values in Million USD)
|
% Change
|
|
DEC'20
|
DEC'21
|
DEC'21
|
|
|
Commodity groups exhibiting positive growth
|
|
1
|
Petroleum Products
|
2336.63
|
5887.67
|
151.97
|
|
2
|
Coffee
|
44.00
|
98.47
|
123.80
|
|
3
|
Mica, Coal & Other Ores, Minerals including processed minerals
|
337.08
|
539.23
|
59.97
|
|
4
|
Plastic & Linoleum
|
570.49
|
899.85
|
57.73
|
|
5
|
Cotton Yarn/Fabs./made-ups, Handloom Products etc.
|
987.76
|
1443.98
|
46.19
|
|
6
|
Other cereals
|
96.24
|
140.17
|
45.65
|
|
7
|
Engineering Goods
|
7072.63
|
9788.88
|
38.41
|
|
8
|
Man-made Yarn/Fabs./made-ups etc.
|
380.52
|
518.22
|
36.19
|
|
9
|
Electronic Goods
|
1248.33
|
1672.59
|
33.99
|
|
10
|
Rice
|
682.77
|
895.08
|
31.10
|
|
11
|
Marine Products
|
562.85
|
720.51
|
28.01
|
|
12
|
Organic & Inorganic Chemicals
|
2100.00
|
2664.15
|
26.86
|
|
13
|
RMG of all Textiles
|
1195.78
|
1466.43
|
22.63
|
|
14
|
Fruits & Vegetables
|
190.07
|
227.53
|
19.71
|
|
15
|
Leather & leather products
|
338.49
|
404.41
|
19.48
|
|
16
|
Meat, dairy & poultry products
|
335.53
|
396.89
|
18.29
|
|
17
|
Gems & Jewellery
|
2575.67
|
2997.44
|
16.38
|
|
18
|
Oil seeds
|
147.72
|
165.29
|
11.90
|
|
19
|
Jute Mfg. including Floor Covering
|
41.78
|
46.73
|
11.86
|
|
20
|
Handicrafts excl. handmade carpet
|
180.34
|
196.13
|
8.75
|
|
21
|
Cereal preparations & miscellaneous processed items
|
183.48
|
199.18
|
8.56
|
|
22
|
Carpet
|
156.08
|
166.14
|
6.45
|
|
23
|
Drugs & Pharmaceuticals
|
2203.53
|
2318.04
|
5.20
|
|
Sl. No.
|
Commodities
|
(Values in Million USD)
|
% Change
|
|
DEC'20
|
DEC'21
|
DEC'21
|
|
|
Commodity Groups exhibiting negative growth
|
|
24
|
Iron Ore
|
382.38
|
54.44
|
-85.76
|
|
25
|
Oil Meals
|
236.75
|
119.67
|
-49.45
|
|
26
|
Cashew
|
52.29
|
39.09
|
-25.24
|
|
27
|
Spices
|
344.92
|
314.40
|
-8.85
|
|
28
|
Tea
|
74.43
|
68.61
|
-7.82
|
|
29
|
Ceramic products & glassware
|
310.62
|
294.23
|
-5.28
|
|
30
|
Tobacco
|
82.88
|
82.13
|
-0.90
|
Table 6: Import Growth in Commodity Groups in December 2021
|
Sl. No.
|
Commodities
|
(Values in Million USD)
|
% Change
|
|
DEC'20
|
DEC'21
|
DEC'21
|
|
|
Commodity Groups exhibiting positive growth
|
|
1
|
Silver
|
10.39
|
232.04
|
2133.30
|
|
2
|
Sulphur & Unroasted Iron Pyrites
|
19.69
|
69.95
|
255.26
|
|
3
|
Fertilisers, Crude & manufactured
|
632.38
|
1712.03
|
170.73
|
|
4
|
Newsprint
|
12.07
|
27.18
|
125.19
|
|
5
|
Pulp and Waste paper
|
75.53
|
164.25
|
117.46
|
|
6
|
Metaliferrous ores & other minerals
|
429.52
|
857.30
|
99.59
|
|
7
|
Organic & Inorganic Chemicals
|
1879.88
|
3253.17
|
73.05
|
|
8
|
Coal, Coke & Briquettes, etc.
|
1624.32
|
2803.09
|
72.57
|
|
9
|
Cotton Raw & Waste
|
30.58
|
52.73
|
72.43
|
|
10
|
Project goods
|
127.03
|
215.58
|
69.71
|
|
11
|
Petroleum, Crude & products
|
9629.01
|
16165.97
|
67.89
|
|
12
|
Leather & leather products
|
50.02
|
76.08
|
52.10
|
|
13
|
Vegetable Oil
|
1210.88
|
1827.33
|
50.91
|
|
14
|
Dyeing/tanning/colouring materials
|
281.04
|
402.57
|
43.24
|
|
15
|
Artificial resins, plastic materials, etc.
|
1434.57
|
1970.30
|
37.34
|
|
16
|
Iron & Steel
|
1265.30
|
1722.90
|
36.17
|
|
17
|
Non-ferrous metals
|
1303.56
|
1705.32
|
30.82
|
|
18
|
Electronic goods
|
5037.69
|
6427.30
|
27.58
|
|
19
|
Fruits & vegetables
|
240.36
|
305.64
|
27.16
|
|
20
|
Textile yarn Fabric, made-up articles
|
180.93
|
229.20
|
26.68
|
|
21
|
Pearls, precious & Semi-precious stones
|
2397.17
|
2891.13
|
20.61
|
|
22
|
Machinery, electrical & non-electrical
|
3149.33
|
3796.75
|
20.56
|
|
23
|
Medicinal & Pharmaceutical products
|
623.44
|
743.89
|
19.32
|
|
24
|
Wood & Wood products
|
470.32
|
548.23
|
16.57
|
|
25
|
Professional instrument, Optical goods, etc.
|
467.38
|
511.74
|
9.49
|
|
26
|
Chemical material & products
|
876.78
|
942.36
|
7.48
|
|
27
|
Gold
|
4485.76
|
4729.47
|
5.43
|
|
28
|
Machine tools
|
347.52
|
363.26
|
4.53
|
|
Sl. No.
|
Commodities
|
(Values in Million USD)
|
% Change
|
|
DEC'20
|
DEC'21
|
DEC'21
|
|
|
Commodity Groups exhibiting negative growth
|
|
29
|
Pulses
|
294.61
|
189.65
|
-35.63
|
|
30
|
Transport equipment
|
2476.59
|
2306.43
|
-6.87
|
Table 7: MERCHANDISE TRADE
|
EXPORTS & IMPORTS: (Rs. Crore)
|
|
(PROVISIONAL)
|
|
|
DECEMBER
|
APRIL-DECEMBER
|
|
EXPORTS(including re-exports)
|
|
|
|
2019-20
|
1,92,984.47
|
16,77,370.97
|
|
2020-21
|
2,00,294.50
|
15,00,019.98
|
|
2021-22
|
2,84,960.74
|
22,38,821.02
|
|
%Growth 2021-22/ 2020-21
|
42.27
|
49.25
|
|
%Growth 2021-22/ 2019-20
|
47.66
|
33.47
|
|
IMPORTS
|
|
|
|
2019-20
|
2,81,880.86
|
25,62,539.91
|
|
2020-21
|
3,15,970.77
|
19,56,256.92
|
|
2021-22
|
4,48,352.86
|
32,98,494.98
|
|
%Growth 2021-22/ 2020-21
|
41.90
|
68.61
|
|
%Growth 2021-22/ 2019-20
|
59.06
|
28.72
|
|
TRADE BALANCE
|
|
|
|
2019-20
|
-88,896.39
|
-8,85,168.94
|
|
2020-21
|
-1,15,676.27
|
-4,56,236.94
|
|
2021-22
|
-1,63,392.12
|
-10,59,673.96
|
Table 8: SERVICES TRADE
|
EXPORTS & IMPORTS (SERVICES) : (US $ Billion)
|
|
|
(PROVISIONAL)
|
November 2021
|
April-
November 2021
|
|
EXPORTS (Receipts)
|
20.14
|
157.62
|
|
IMPORTS (Payments)
|
12.59
|
90.43
|
|
TRADE BALANCE
|
7.55
|
67.19
|
|
|
|
|
|
EXPORTS & IMPORTS (SERVICES): (Rs. Crore)
|
|
|
(PROVISIONAL)
|
November 2021
|
April-
November 2021
|
|
EXPORTS (Receipts)
|
1,50,006.15
|
11,68,297.72
|
|
IMPORTS (Payments)
|
93,753.85
|
6,70,401.42
|
|
TRADE BALANCE
|
56,252.31
|
4,97,896.29
|
|
Source: RBI Press Release dated 4th January 2022
|
|
***
* Link for quick estimates
DJN/PK/MS
(Release ID: 1789882)
Visitor Counter : 17742