Ministry of Commerce & Industry
INDIA’S FOREIGN TRADE: September 2018
Posted On:
15 OCT 2018 9:00PM by PIB Delhi
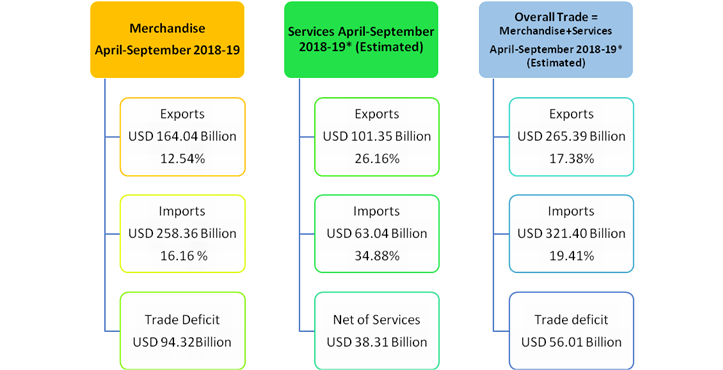
India’s overall exports (Merchandise and Services combined) in April-September 2018-19* are estimated to be USD 265.39 Billion, exhibiting a positive growth of 17.38 per cent over the same period last year. Overall imports in April- September 2018-19* are estimated to be USD 321.40 Billion, exhibiting a positive growth of 19.41 per cent over the same period last year.
*Note: Services data pertains to April-August 2018-19 as August 2018 is the latest data available as per RBI’s Press Release dated 15th October 2018. It is arrived at by adding Month-wise QE dataof RBI’s press release for April to August 2018-19. This data is provisional and subject to revision by RBI. In addition, it may be noted that data for September 2018 is estimated and added to the April-August 2018-19 data of RBI to calculate the Overall Trade Deficit for April-September 2018-19. It will be revised based on RBI’s next press release for September 2018.
I. MERCHANDISE TRADE
EXPORTS (including re-exports)
Exports inSeptember 2018 were US $ 27.95 Billion, as compared to US $ 28.57Billion in September 2017, exhibiting a negative growth of 2.15per cent. In Rupee terms, exports were Rs. 2,01,857.62Crore in September 2018, as compared to Rs. 1,84,088.94 Crore in September 2017, registering a positive growth of 9.65per cent.
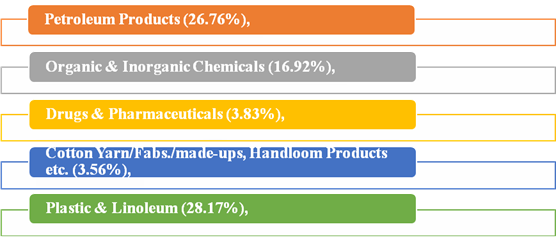
InSeptember 2018, major commodity groups of export showing positive growth over the corresponding month of last year are
Cumulative value of exports for the period April-September 2018-19 was US $ 164.04 Billion (Rs.11,25,305.44 Crore) as against US $ 145.75 Billion (Rs.9,38,307.83 Crore) during the period April-September 2017-18, registering a positive growth of 12.54per cent in Dollar terms (19.93per cent in Rupee terms).
Non-petroleum and Non Gems and Jewellery exports in September 2018 were US $ 19.80 Billion, as compared to US $ 20.31 Billion in September 2017, exhibiting a negative growth of 2.49 per cent. Non-petroleum and Non Gems and Jewellery exports in April-September 2018-19 were US $ 119.05 Billion, as compared to US $ 107.91 Billion for the corresponding period in 2017-18, an increase of 10.32 %.
IMPORTS
Imports in September 2018 were US $ 41.93Billion (Rs. 3,02,804.39 Crore), which was 10.45 per cent higher in Dollar terms and 23.78per cent higher in Rupee terms over imports of US $ 37.96 Billion (Rs.2,44,634.86 Crore) in September 2017. Cumulative value of imports for the period April-September 2018-19 was US $ 258.36 Billion (Rs.17,72,283.63Crore), as against US $ 222.42 Billion (Rs.14,31,823.75 Crore) during the period April-September 2017-18, registering a positive growth of 16.16per cent in Dollar terms (23.78 per cent in Rupee terms).
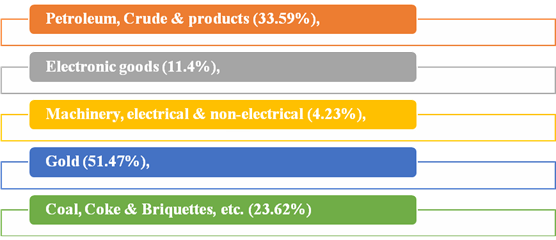
Major commodity groups of import showing high growth in September 2018 over the corresponding month of last year are:
CRUDE OIL AND NON-OIL IMPORTS:
Oil imports inSeptember 2018 were US $ 10.91 Billion (Rs. 78,811.17 Crore), which was 33.59 percent higher in Dollar terms (49.71 percent higher in Rupee terms), compared to US $ 8.17 Billion (Rs. 52,642.37 Crore) in September 2017. Oil imports in April-September 2018-19 were US $ 69.73 Billion (Rs. 4,78,183.10 Crore) which was 50.05 per cent higher in Dollar terms (59.85 percent higher in Rupee terms) compared to US $ 46.47 Billion (Rs. 2,99,147.05 Crore), over the same period last year.
In this connection it is mentioned that the global Brent price ($/bbl) has increased by 42.97% in September 2018 vis-à-vis September 2017 as per data available from World Bank (Pink Sheet).
Non-oil imports inSeptember 2018 were estimated at US $ 31.02 Billion (Rs.2,23,993.22 Crore) which was 4.11 per cent higher in Dollar terms (16.67 percent higher in Rupee terms), compared to US $ 29.79 Billion (Rs. 1,91,992.49 Crore) in September 2017. Non-oil imports in April-September 2018-19 were US $ 188.63 Billion (Rs.12,94,100.53 Crore) which was 7.21 per cent higher in Dollar terms (14.25 percent higher in Rupee terms), compared to US $ 175.95 Billion (Rs. 1132676.70 Crore) in April-September2017-18.
Non-Oil and Non-Gold imports were US $ 28.42 billion in September 2018, recording a positive growth of 1.22 per cent, as compared to Non-Oil and Non-Gold imports in September 2017. Non-Oil and Non-Gold imports were US $ 170.99 billion in April-September 2018-19, recording a positive growth of 7.57 per cent, as compared to Non-Oil and Non-Gold imports in April-September 2017-18.
II. TRADE IN SERVICES (for August, 2018, as per the RBI Press Release dated 15th October 2018)
EXPORTS (Receipts)
Exports inAugust2018 were US $ 16.53 Billion (Rs.1,14,932.55Crore) registering a negative growth of 5.85 per cent in dollar terms,vis-à-vis July 2018. (as per RBI’s Press Release for the respective months).
IMPORTS (Payments)
Imports inAugust 2018 were US $ 10.35 Billion (Rs. 72,008.45 Crore) registering a negative growth of 4.57 per cent in dollar terms,vis-à-vis July 2018. (as per RBI’s Press Release for the respective months).
III.TRADE BALANCE
MERCHANDISE: The trade deficit for September 2018 was estimated at US $ 13.98 Billion as against the deficit of US $ 9.40 Billion inSeptember 2017.
SERVICES: As per RBI’s Press Release dated 15th October 2018, the trade balance in Services (i.e. Net Services export) for August, 2018 is estimated at US $ 6.17 Billion.
OVERALL TRADE BALANCE: Taking merchandise and services together, overall trade deficit for April-September 2018-19* is estimated at US $ 56.01 Billion as compared to US $ 43.07 Billion in April-September 2017-18.
*Note: Services data pertains to April-August 2018-19 as August 2018 is the latest data available as per RBI’s Press Release dated 15th October 2018. It is arrived at by adding Month-wise QE dataof RBI’s press release for April to August 2018-19. This data is provisional and subject to revision by RBI. In addition, it may be noted that data for September 2018 is estimated and added to the April-August 2018-19 data of RBI to calculate the Overall Trade Deficit for April-September 2018-19. It will be revised based on RBI’s next press release for September 2018.
…
MERCHANDISE TRADE
|
EXPORTS & IMPORTS: (US $ Billion)
|
|
(PROVISIONAL)
|
|
|
SEPTEMBER
|
APRIL-SEPTEMBER
|
|
EXPORTS (including re-exports)
|
|
|
|
2017-18
|
28.57
|
145.75
|
|
2018-19
|
27.95
|
164.04
|
|
%Growth 2018-19/ 2017-18
|
-2.15
|
12.54
|
|
IMPORTS
|
|
|
|
2017-18
|
37.96
|
222.42
|
|
2018-19
|
41.93
|
258.36
|
|
%Growth 2018-19/ 2017-18
|
10.45
|
16.16
|
|
TRADE BALANCE
|
|
|
|
2017-18
|
-9.40
|
-76.66
|
|
2018-19
|
-13.98
|
-94.32
|
|
EXPORTS & IMPORTS: (Rs. Crore)
|
|
(PROVISIONAL)
|
|
|
SEPTEMBER
|
APRIL-SEPTEMBER
|
|
EXPORTS(including re-exports)
|
|
|
|
2017-18
|
1,84,088.94
|
9,38,307.83
|
|
2018-19
|
2,01,857.62
|
11,25,305.44
|
|
%Growth 2018-19/ 2017-18
|
9.65
|
19.93
|
|
IMPORTS
|
|
|
|
2017-18
|
2,44,634.86
|
14,31,823.75
|
|
2018-19
|
3,02,804.39
|
17,72,283.63
|
|
%Growth 2018-19/ 2017-18
|
23.78
|
23.78
|
|
TRADE BALANCE
|
|
|
|
2017-18
|
- 60,545.92
|
- 4,93,515.92
|
|
2018-19
|
-1,00,946.77
|
-6,46,978.19
|
SERVICES TRADE
|
EXPORTS & IMPORTS (SERVICES) : (US $ Billion)
|
|
(Provisional)
|
AUGUST 2018
|
APRIL-AUGUST 2018-19
|
|
EXPORTS (Receipts)
|
16.53
|
84.69
|
|
IMPORTS (Payments)
|
10.35
|
52.63
|
|
TRADE BALANCE
|
6.17
|
32.06
|
|
EXPORTS & IMPORTS (SERVICES): (Rs. Crore)
|
|
|
(Provisional)
|
AUGUST 2018
|
APRIL-AUGUST 2018-19
|
|
EXPORTS (Receipts)
|
1,14,932.55
|
5,74,399.09
|
|
IMPORTS (Payments)
|
72,008.45
|
3,56,947.14
|
|
TRADE BALANCE
|
42,924.10
|
2,17,451.95
|
Note: Services data of 2018-19 pertains to April-August 2018-19 as August 2018 is the latest data available as per RBI’s Press Release dated 15th October 2018. April-August 2017-18 data is arrived by adding Month-wise QE data.
This has been used along with the estimate of service export and import for September 2018, as explained in page-1 for the purpose of this Press note.
Quick Estimates for Selected Major Commodities for September 2018
*****
MM/SB
(Release ID: 1549811)
Visitor Counter : 1486