Crude Oil
- Crude oil production[1] during September, 2019 was 2646.51 TMT which is 7.09% lower than target and 5.41% lower when compared with September 2018. Cumulative crude oil production during April-September, 2019 was 16372.02 TMT which is 4.52% and 5.96% lower than target for the period and production during corresponding period of last year respectively. Unit-wise and State-wise crude oil production is given at Annexure-I. Unit-wise crude oil production for the month of September, 2019 and cumulatively for the period April-September, 2019 vis-à-vis same period of last year has been shown in Table-1 and month-wise in Figure-1.
Table-1: Crude Oil Production (in TMT)
|
Oil Company
|
Target
|
September (Month)
|
April-September (Cumulative)
|
|
2019-20 (Apr-Mar)
|
2019-20
|
2018-19
|
% over last year
|
2019-20
|
2018-19
|
% over last year
|
|
Target
|
Prod.*
|
Prod.
|
Target
|
Prod.*
|
Prod.
|
|
ONGC
|
22153.90
|
1763.81
|
1667.55
|
1711.27
|
97.45
|
10523.89
|
10252.18
|
10676.10
|
96.03
|
|
OIL
|
3424.90
|
279.47
|
259.48
|
274.28
|
94.60
|
1695.14
|
1614.26
|
1685.69
|
95.76
|
|
PSC Fields
|
9463.34
|
805.05
|
719.48
|
812.30
|
88.57
|
4927.87
|
4505.58
|
5047.61
|
89.26
|
|
Total
|
35042.15
|
2848.34
|
2646.51
|
2797.84
|
94.59
|
17146.90
|
16372.02
|
17409.39
|
94.04
|
Note: Totals may not tally due to rounding off. *: Provisional
Figure-1: Monthly Crude Oil Production 
Unit-wise production details with reasons for shortfall are as under:
-
- Crude oil production by ONGC during September, 2019 was 1667.55 TMT which is 5.46% lower than the target and 2.55% lower when compared with September, 2018. Cumulative crude oil production by ONGC during April-September, 2019 was 10252.18 TMT which is 2.58% and 3.97% lower than target for the period and production during corresponding period of last year respectively. Reasons for shortfall in production are as under:
- ESP issues in wells of NBP field and Ratna R-series.
- Two wells put back on production through rig intervention. Rig deployed at NBP-A well platform and rig mobilization planned for remaining wells post monsoon.
- Increase in water cut in certain wells of Mumbai High, Heera, Neelam & B173A fields
- Sub-sea leakage in some well fluid lines of MH Asset leading to flow restriction.
- Production loss due to power Shut Downs & Electrical faults due to rains/winds/ thunderstorms/ water logging in Western Onshore Assets
- Decline in FTHP (Flowing Tubing Head Pressure) & increase in water-cut in Kesanapalli West field in Rajahmundry
-
- Crude oil production by OIL during September, 2019 was 259.48 TMT which is 7.15% lower than monthly target and 5.40% lower when compared with September, 2018. Cumulative crude oil production by OIL during April-September, 2019 was 1614.26 TMT which is 4.77% and 4.24% lower than target for the period and production during corresponding period of last year respectively. Major reasons for lower production is less than planned contribution from workover wells and drilling wells.
-
- Crude oil production by Pvt/JVs during September, 2019 was 719.48 TMT which is 10.63% lower than the monthly target and 11.43% lower than September, 2018. Cumulative crude oil production by Pvt/JVs during April-September, 2019 was 4505.58 TMT which is 8.57% and 10.74% lower than target for the period and production during corresponding period of last year respectively. Reasons for shortfall in production are as under:
- RJ-ON-90/1-MANGLA (CEIL): Failure in 220 kV line from state grid. Delay in making 45 FM-1/4 infill wells on line. Lag in liquidating the inventory of planned work overs and production optimization jobs. ESP failure in FM-3 well M-357, M-359 and M-387.
- Operational issues in Bhagyam, Aishwarya and ABH fields. (CEIL)
- CB-ONN-2005/9 (Mercator): Oil production from Jyoti-1 is stopped. Well closed for long term pressure build up study and could not be put back in production due to non-grant of EC for development campaign.
Natural Gas
- Natural gas production during September, 2019 was 2568.11 MMSCM which is 8.77% lower than the monthly target and 4.31% lower when compared with September, 2018. Cumulative natural gas production during April-September, 2019 was 16005.11 MMSCM which is 6.03% and 1.53% lower than target for the period and production during corresponding period of last year respectively. Unit-wise and state-wise natural gas production is given at Annexure-II. Unit-wise natural gas production for the month of September, 2019 and cumulatively for the period April-September, 2019 vis-à-vis same period of last year has been shown in Table-2 and month-wise in Figure-2.
Table-2: Natural Gas Production (MMSCM)
|
Oil Company
|
Target
|
September (Month)
|
April-September (Cumulative)
|
|
2019-20 (Apr-Mar)
|
2019-20
|
2018-19
|
% over last year
|
2019-20
|
2018-19
|
% over last year
|
|
Target
|
Prod.*
|
Prod.
|
Target
|
Prod.*
|
Prod.
|
|
ONGC
|
25848.00
|
2066.24
|
1913.42
|
2005.61
|
95.40
|
12577.00
|
12071.71
|
12017.46
|
100.45
|
|
OIL
|
3309.59
|
278.86
|
231.72
|
228.37
|
101.46
|
1697.84
|
1384.38
|
1365.78
|
101.36
|
|
PSC Fields
|
5395.20
|
469.84
|
422.98
|
449.84
|
94.03
|
2757.41
|
2549.03
|
2871.04
|
88.78
|
|
Total
|
34552.79
|
2814.94
|
2568.11
|
2683.82
|
95.69
|
17032.25
|
16005.11
|
16254.29
|
98.47
|
Note: Totals may not tally due to rounding off. *: Provisional
Figure-2: Monthly Natural Gas Production 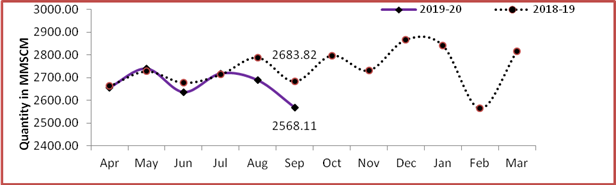
-
- Natural gas production by ONGC during September, 2019 was 1913.42 MMSCM which is 7.40% lower than target and 4.60% lower when compared with September 2018. Cumulative natural gas production by ONGC during April-September, 2019 was 12071.71 MMSCM which is 0.45% higher than the production during the corresponding period of the last year but 4.02% lower than the cumulative target. Reasons for shortfall in production are as under:
- Less gas production due to restriction at Uran end because of fire incident at Uran Plant on 3rd Sept’19. Gas production has since been normalised.
- Intermittent less Off take by M/s GAIL and GSPC Pipavav Power Co. Ltd in Eastern Offshore Asset.
- Less production due to less gas off take by OTPC, Tripura due to planned shut down
- Less production due to less gas off take due to grid restrictions/Shut downs/ marketing issues in Cauvery, Jodhpur, Silchar, Rajahmundry.
- Less gas production due to decline in pressure in Kesanapalli West in Rajahmundry, Kuthalam & Kali in Cauvery, Gandhar in Ankleshwar.
-
- Natural gas production by OIL during September, 2019 was 231.72 MMSCM which is 1.46% higher than the production of corresponding month of late year but lower by 16.91% monthly target. Cumulative natural gas production by OIL during April-September, 2019 was 1384.38 MMSCM which is 1.36% higher than the production during the corresponding period of last year but 18.46% lower than the cumulative target. Reasons for shortfall in production are as under:
- Loss of potential in Deohal area due to presence of CO2 in production stream.
- Environmental loss (Bandh and miscreant activities).
- Less offtake by M/s. BVFCL due to major repeated unscheduled maintenance issue.
-
- Natural gas production by Pvt/JVs during September, 2019 was 422.98 MMSCM which is 9.97% lower than monthly target and 5.97% lower than September, 2018. Cumulative natural gas production by Pvt/JVs during April-September, 2019 was 2549.03 MMSCM which is 7.56% lower than the cumulative target and 11.22% lower than the production during the corresponding period of last year. Reasons for shortfall in production are as under:
- KG-DWN-98/3 (RIL): MA field ceased production and closure of 2 wells in D1D3 field.
- KG-OSN-2001/3 (ONGC): Anticipated production from well DDW D-5 has been delayed.
- RJ-ON/6(FEL): Less offtake by customer.
- Refinery Production (in terms of crude oil processed)
Refinery production during September, 2019 was 19414.84 TMT which is 0.80% lower than the target for the month and 6.89% lower when compared with September, 2018. Cumulative production during April-September, 2019 was 125728.11 TMT which is 0.73% lower than the target for the period and 2.28% lower than the production during corresponding period of last year. Unit-wise production is given at Annexure-III. Company-wise production for the month of September, 2019 and cumulatively for the period April-September, 2019 vis-à-vis same period of last year has been shown in Table-3 and month-wise in Figure-3.
Figure 3: Monthly Refinery Production
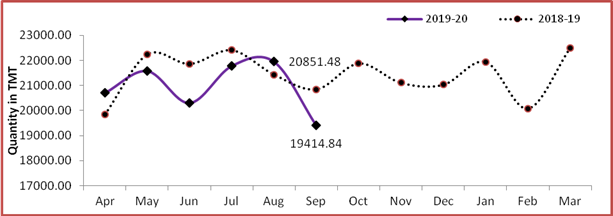
Table 3: Refinery Production (TMT)
|
Oil Company
|
Target
|
September (Month)
|
April-September (Cumulative)
|
|
2019-20 (Apr-Mar)
|
2019-20
|
2018-19
|
% over last year
|
2019-20
|
2018-19
|
% over last year
|
|
Target
|
Prod.*
|
Prod.
|
Target
|
Prod.*
|
Prod.
|
|
CPSE
|
147944.81
|
10497.83
|
10743.97
|
12302.80
|
87.33
|
72130.82
|
71184.24
|
74795.12
|
95.17
|
|
IOCL
|
71900.25
|
5159.18
|
5162.11
|
5706.25
|
90.46
|
35145.09
|
34820.22
|
35482.95
|
98.13
|
|
BPCL
|
30900.00
|
2250.00
|
2257.22
|
2502.00
|
90.22
|
14890.00
|
15205.53
|
15400.99
|
98.73
|
|
HPCL
|
16499.00
|
1104.00
|
1379.24
|
1556.03
|
88.64
|
8685.00
|
8484.47
|
9277.01
|
91.46
|
|
CPCL
|
10400.00
|
680.00
|
743.43
|
960.81
|
77.38
|
5120.00
|
5188.76
|
5526.46
|
93.89
|
|
NRL
|
2799.80
|
250.70
|
210.96
|
240.55
|
87.70
|
1529.40
|
1394.36
|
1426.59
|
97.74
|
|
MRPL
|
15400.00
|
1050.00
|
984.14
|
1332.22
|
73.87
|
6740.00
|
6047.41
|
7652.10
|
79.03
|
|
ONGC
|
45.76
|
3.95
|
6.87
|
4.95
|
138.69
|
21.34
|
43.49
|
29.03
|
149.83
|
|
JVs
|
18755.00
|
1538.00
|
1134.55
|
1012.94
|
112.01
|
9379.00
|
9640.09
|
8718.97
|
110.56
|
|
BORL
|
7800.00
|
640.00
|
532.38
|
0.00
|
0.00
|
3900.00
|
3779.07
|
2515.13
|
150.25
|
|
HMEL
|
10955.00
|
898.00
|
602.18
|
1012.94
|
59.45
|
5479.00
|
5861.02
|
6203.85
|
94.47
|
|
Private
|
88040.52
|
7535.74
|
7536.32
|
7535.74
|
100.01
|
45143.87
|
44903.78
|
45143.87
|
99.47
|
|
RIL
|
69145.00
|
5801.34
|
5894.55
|
5801.34
|
101.61
|
34597.75
|
34503.02
|
34597.75
|
99.73
|
|
EOL
|
18895.52
|
1734.40
|
1641.76
|
1734.40
|
94.66
|
10546.12
|
10400.76
|
10546.12
|
98.62
|
|
TOTAL
|
254740.32
|
19571.57
|
19414.84
|
20851.48
|
93.11
|
126653.69
|
125728.11
|
128657.96
|
97.72
|
Note: Totals may not tally due to rounding off. *: Provisional
-
- CPSE Refineries’ production during September, 2019 was 10743.97 TMT which is 2.34% higher than the target for the month but 12.67% lower when compared with September, 2018. Cumulative production by CPSE refineries during April-September, 2019 was 71184.24 TMT which is 1.31% lower than the target for the period and 4.83% lower than the production during corresponding period of last year. Reasons for shortfall of refinery production in some CPSE refineries are as under:
- IOCL, Barauni: DHDT feed high stock due to Diesel Containment.
- IOCL, Gujarat: Crude Units idling due to HSD containment.
- IOCL, Panipat: Deferment of planned shutdown.
- BPCL, Kochi: Planned Shutdown of CDU 2/DHDT/VGOHDT.
- CPCL, Manali: CDU-1 M&I shutdown.
3.2 Production in JV refineries during September, 2019 was 1134.55 TMT which is 12.01% higher when compared with the production of September, 2019 and 26.23% lower than the target for the month. Cumulative production by JVs refineries during April-September, 2019 was 9640.09 TMT which is 2.78% higher than the target for the period and 10.56% higher than the production during corresponding period of last year.
3.3 Production in private refineries during September, 2019 was 7536.32 TMT which is marginally higher by 0.01% than the target both for the month and corresponding month of last year. Cumulative production by private refineries during April-September, 2019 was 44903.78 TMT which is lower by 0.53% each against the target and corresponding period of last year.
YB
(Release ID :193931)