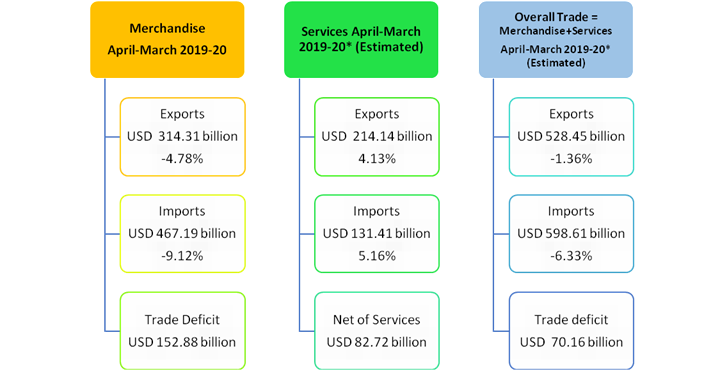
India’s overall exports (Merchandise and Services combined) in April-March2019-20* are estimated to be USD 528.45billion, exhibiting a negative growth of (-) 1.36per cent over the same period last year. Overall imports in April-March 2019-20* are estimated to be USD 598.61billion, exhibiting a negative growth of (-)6.33per cent over the same period last year.

*Note: The latest data for services sector released by RBI is for February2020. The data for March2020 is an estimation, which will be revised based on RBI’s subsequent release.
I. MERCHANDISE TRADE
EXPORTS (including re-exports)
Exports inMarch2020 were USD21.41billion, as compared to USD32.72billion in March 2019, exhibiting a negative growth of (-) 34.57per cent. In Rupee terms, exports were Rs. 1,59,157.98crore in March2020, as compared to Rs. 2,27,318.25crore in March2019, registering a negative growth of (-) 29.98per cent.The decline in exports has been mainly due to the ongoing global slowdown, which got aggravated due to the current Covid-19 crisis. The latter resulted in large scale disruptions in supply chainsand demand resulting in cancellation of orders.
Except for Iron ore, which registered a growth of 58.43%, all other commodity/commodity groups have registered negative growth in March 2020vis-a-vs March 2019.
Major commodity groups which have recorded negative growth during March 2020 vis-à-vis March 2019 are Oil meals (-69.85%), Meat, dairy & poultry products (-45.48%), Engineering goods (-42.32%), Gems & jewellery (-41.05%), Leather & leather products (-36.78%), Plastic & Linoleum (-35.67%), RMG of all textiles (-34.91%), Carpet (-34.72%), Mica, Coal & other ores, minerals including processed minerals (-34.06%), Tea (-33.74%), Other cereals (-33.42%), Organic & inorganic chemicals (-32.88%), Cotton yarn/fabs./made-ups, Handloom products etc. (-32.16%), Petroleum products (-31.12%) and Rice (-28.28%).
Cumulative value of exports for the period April-March 2019-20 was USD314.31billion (Rs.22,26,566.71crore) as against USD330.08billion (Rs.23,07,726.19crore) during the period April-March 2018-19, registering a negative growth of (-)4.78per cent in Dollar terms (negative growth of (-)3.52per cent in Rupee terms).
Non-petroleum and Non-Gems and Jewellery exports in March 2020 were USD16.90billion, as compared to USD25.68billion in March2019, exhibiting a negative growth of (-) 34.19per cent. Non-petroleum and Non-Gems and Jewellery exports in April-March 2019-20 were USD235.73billion, as compared to USD243.27billion for the corresponding period in 2018-19, a decrease of (-) 3.10 per cent.
IMPORTS
Imports in March2020 were USD31.16billion (Rs.2,31,710.92crore), which was 28.72per cent lower in Dollar terms and 23.72per cent lower in Rupee terms over imports of USD43.72billion (Rs3,03,753.76crore) in March2019. Cumulative value of imports for the period April-March 2019-20 was USD467.19billion (Rs.33,07,977.05crore), as against USD514.08billion (Rs.35,94,674.61crore) during the period April-March 2018-19, registering a negative growth of (-)9.12per cent in Dollar terms (negative growth of (-)7.98per cent in Rupee terms).
Major commodity groups of import showing negative growth in March2020 over the corresponding month of last year are:

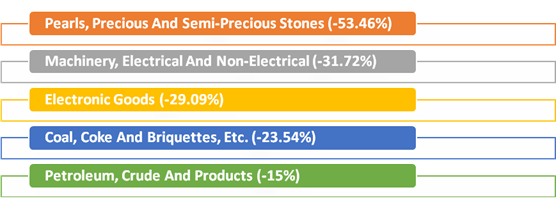
Rise in import in March 2020 was witnessed only in Transport equipment, which registered a growth of 11.94% over March 2019.
CRUDE OIL AND NON-OIL IMPORTS:
Oil imports inMarch2020 were USD10.01billion (Rs. 74,462.00crore), which was 15.00percentlower in Dollar terms (9.03percent lower in Rupee terms), compared to USD11.78billion (Rs. 81,857.53crore) in March2019. Oil imports in April-March 2019-20 were USD129.43billion (Rs. 9,17,306.25crore) which was 8.15per cent lower in Dollar terms (6.99percent lower in Rupee terms) compared to USD140.92billion (Rs. 9,86,275.06crore), over the same period last year.
In this connection it is mentioned that the global Brent price ($/bbl) has decreased by 50.34% in March2020 vis-à-vis March2019 as per data available from World Bank.
Non-oil imports inMarch2020 were estimated at USD21.15billion (Rs. 1,57,248.92crore) which was 33.78per cent lower in Dollar terms (29.13percent lower in Rupee terms), compared to USD31.94billion (Rs. 2,21,896.23crore) in March2019. Non-oil imports in April-March 2019-20 were USD337.76billion (Rs. 23,90,670.80crore) which was 9.49per cent lower in Dollar terms (8.35percent lower in Rupee terms), compared to USD373.16billion (Rs. 26,08,399.55crore) in April-March2018-19.
Non-Oil and Non-Gold imports wereUSD19.92billion in March2020, recording a negative growth of (-)30.47per cent, as compared to Non-Oil and Non-Gold importsof USD 28.65billion in March2019. Non-Oil and Non-Gold imports wereUSD309.53billion in April-March 2019-20, recording a negative growth of (-)9.03per cent, as compared to Non-Oil and Non-Gold importsUSD 340.25billion in April-March 2018-19.
II. TRADE IN SERVICES
EXPORTS (Receipts)
As per the latest press release by RBI dated 15th April 2020, exports in February2020 were USD 17.73billion (Rs. 1,26,713.37crore) registering a positive growth of 6.88per cent in dollar terms, vis-à-vis February2019. The estimated value of services export for March2020* is USD 17.69billion.
IMPORTS (Payments)
As per the latest press release by RBI dated 15th April 2020, imports in February 2020 were USD 11.07billion (Rs. 79,116.32crore) registering a positive growth of 12.82per cent in dollar terms, vis-à-vis February2019. The estimated value of service import for March2020* is USD 10.97billion.
III.TRADE BALANCE
MERCHANDISE: The trade deficit for March2020 was estimated at USD 9.76billion as against the deficit of USD11.00billion inMarch2019.
SERVICES: As per RBI’s Press Release dated 15th April 2020, the trade balance in Services (i.e. Net Services export) for February 2020 is estimated at USD6.66billion.
OVERALL TRADE BALANCE: Taking merchandise and services together, overall trade deficit for April-March 2019-20* is estimated at USD70.16billion as compared to USD103.32billion in April-March 2018-19.
*Note: The latest data for services sector released by RBI is for February2020. The data for March2020 is an estimation, which will be revised based on RBI’s subsequent release.
MERCHANDISE TRADE
|
EXPORTS & IMPORTS : (US $ Billion)
|
|
(PROVISIONAL)
|
|
|
MARCH
|
APRIL-MARCH
|
|
EXPORTS(including re-exports)
|
|
|
|
2018-19
|
32.72
|
330.08
|
|
2019-20
|
21.41
|
314.31
|
|
%Growth 2019-20/ 2018-19
|
-34.57
|
-4.78
|
|
IMPORTS
|
|
|
|
2018-19
|
43.72
|
514.08
|
|
2019-20
|
31.16
|
467.19
|
|
%Growth 2019-20/ 2018-19
|
-28.72
|
-9.12
|
|
TRADE BALANCE
|
|
|
|
2018-19
|
-11.00
|
-184.00
|
|
2019-20
|
-9.76
|
-152.88
|
|
|
|
|
|
EXPORTS &IMPORTS: (Rs. Crore)
|
|
|
(PROVISIONAL)
|
|
|
|
MARCH
|
APRIL-MARCH
|
|
EXPORTS(including re-exports)
|
|
|
|
2018-19
|
2,27,318.25
|
23,07,726.19
|
|
2019-20
|
1,59,157.98
|
22,26,566.71
|
|
%Growth 2019-20/ 2018-19
|
-29.98
|
-3.52
|
|
IMPORTS
|
|
|
|
2018-19
|
3,03,753.76
|
35,94,674.61
|
|
2019-20
|
2,31,710.92
|
33,07,977.05
|
|
%Growth 2019-20/ 2018-19
|
-23.72
|
-7.98
|
|
TRADE BALANCE
|
|
|
|
2018-19
|
-76,435.51
|
-12,86,948.42
|
|
2019-20
|
-72,552.94
|
-10,81,410.34
|
SERVICES TRADE
|
EXPORTS & IMPORTS (SERVICES) : (US $ Billion)
|
|
(PROVISIONAL)
|
February 2020
|
April-February 2019-20
|
|
EXPORTS (Receipts)
|
17.73
|
196.44
|
|
IMPORTS (Payments)
|
11.07
|
120.45
|
|
TRADE BALANCE
|
6.66
|
76.00
|
|
|
|
|
|
EXPORTS & IMPORTS (SERVICES): (Rs. Crore)
|
|
(PROVISIONAL)
|
February 2020
|
April-February 2019-20
|
|
EXPORTS (Receipts)
|
1,26,713.37
|
13,86,895.98
|
|
IMPORTS (Payments)
|
79,116.32
|
8,50,362.57
|
|
TRADE BALANCE
|
47,597.04
|
5,36,533.41
|
|
Source: RBI Press Release dated 15thApril 2020
|
|
*Note: The latest data for services sector released by RBI is for February2020. The data for March2020 is an estimation, which will be revised based on RBI’s subsequent release.
QUICK ESTIMATES FOR SELECTED MAJOR COMMODITIES FOR MARCH 2020
******
YB/AP