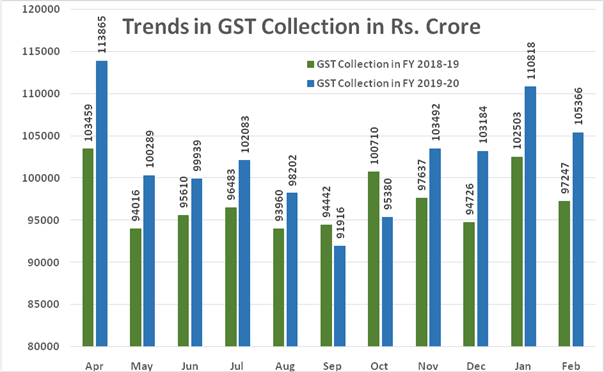
The gross GST revenue collected in the month of February, 2020is ₹ 1,05,366crore of which CGST is ₹ 20,569crore, SGST is ₹ 27,348crore, IGST is ₹ 48,503crore (including ₹ 20,745crore collected on imports) and Cess is ₹ 8,947 crore (including ₹ 1,040crore collected on imports). The total number of GSTR 3B Returns filed for the month of January up to 29th February, 2020 is 83.53lakh.
The government has settled ₹ 22,586 crore to CGST and ₹ 16,553 crore to SGST from IGST as regular settlement. The total revenue earned by Central Government and the State Governments after regular settlement in the month of February,2020 is ₹ 43,155 crore for CGST and ₹ 43,901 crore for the SGST.
The GST revenues during the month of February, 2020 from domestic transactions has shown a growth of 12% over the revenue during the month of February, 2019. Taking into account the GST collected from import of goods, the total revenue during February, 2020has increased by 8% in comparison to the revenue during February, 2019. During this month, the GST on import of goods has shown a negative growth of (-) 2% as compared to February, 2019.
The chart shows trends in revenue during the current year. The table shows the state-wise figures of GST collected in each State during the month of February, 2020 as compared to Feb, 2019.

State-wise GST revenue in February
(₹ crore)
|
State
|
Feb-19
|
Feb-20
|
Growth
|
|
Jammu and Kashmir
|
306
|
316
|
3%
|
|
Himachal Pradesh
|
610
|
621
|
2%
|
|
Punjab
|
1,100
|
1,229
|
12%
|
|
Chandigarh
|
147
|
172
|
18%
|
|
Uttarakhand
|
1,237
|
1,281
|
4%
|
|
Haryana
|
4,873
|
5,266
|
8%
|
|
Delhi
|
3,422
|
3,835
|
12%
|
|
Rajasthan
|
2,676
|
2,932
|
10%
|
|
Uttar Pradesh
|
5,112
|
5,776
|
13%
|
|
Bihar
|
961
|
1,121
|
17%
|
|
Sikkim
|
145
|
183
|
26%
|
|
Arunachal Pradesh
|
32
|
48
|
51%
|
|
Nagaland
|
20
|
25
|
27%
|
|
Manipur
|
21
|
37
|
77%
|
|
Mizoram
|
22
|
25
|
12%
|
|
Tripura
|
46
|
63
|
37%
|
|
Meghalaya
|
129
|
157
|
21%
|
|
Assam
|
736
|
924
|
25%
|
|
West Bengal
|
3,490
|
3,942
|
13%
|
|
Jharkhand
|
2,121
|
2,071
|
-2%
|
|
Odisha
|
2,374
|
2,790
|
18%
|
|
Chattisgarh
|
2,068
|
2,274
|
10%
|
|
Madhya Pradesh
|
2,291
|
2,621
|
14%
|
|
Gujrat
|
6,507
|
7,216
|
11%
|
|
Daman and Diu
|
92
|
94
|
2%
|
|
Dadra and Nagar Haveli
|
139
|
145
|
5%
|
|
Maharastra
|
14,092
|
15,735
|
12%
|
|
Karnataka
|
6,453
|
7,414
|
15%
|
|
Goa
|
401
|
411
|
2%
|
|
Lakshadweep
|
3
|
2
|
-20%
|
|
Kerala
|
1,416
|
1,754
|
24%
|
|
Tamil Nadu
|
5,974
|
6,427
|
8%
|
|
Puducherry
|
175
|
159
|
-9%
|
|
Andman and Nikobar Island
|
25
|
36
|
45%
|
|
Telangana
|
3,460
|
3,667
|
6%
|
|
Andhra Pradesh
|
2,088
|
2,563
|
23%
|
|
Other Teritory
|
141
|
145
|
3%
|
|
Center Jurisdiction
|
47
|
100
|
114%
|
|
Grand Total
|
74,952
|
83,581
|
12%
|
*****
RM/KMN