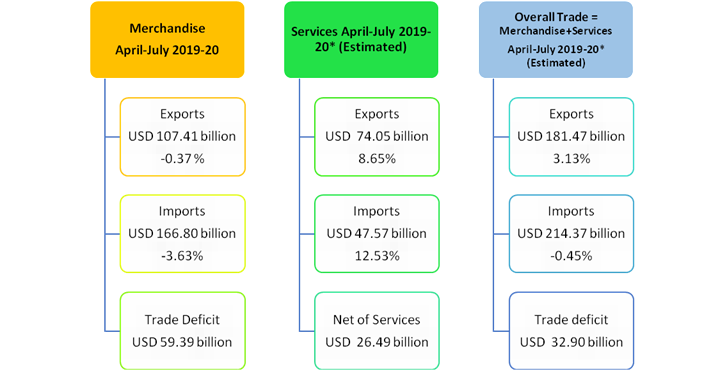
India’s overall exports (Merchandise and Services combined) in April-July2019-20* are estimated to be USD 181.47billion, exhibiting a positive growth of 3.13per cent over the same period last year. Overall imports in April-July 2019-20* are estimated to be USD 214.37billion, exhibiting a negative growth of 0.45per cent over the same period last year.
*Note: The latest data for services sector released by RBI is for June 2019. The data for July 2019 is an estimation, which will be revised based on RBI’s subsequent release.
I. MERCHANDISE TRADE
EXPORTS (including re-exports)
Exports inJuly 2019 were USD26.33billion, as compared to USD25.75billion in July 2018, exhibiting a positive growth of 2.25per cent. In Rupee terms, exports were Rs. 1,81,190.34crore in July 2019, as compared to Rs. 1,76,914.60crore in July 2018, registering a positive growth of 2.42per cent.
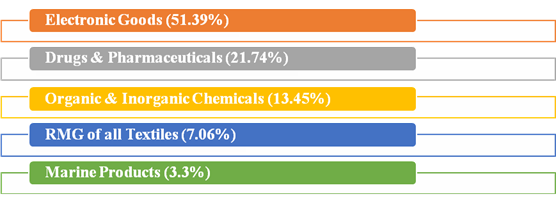
In July 2019, major commodity groups of export showing positive growth over the corresponding month of last year are
Cumulative value of exports for the period April-July 2019-20 was USD107.41billion (Rs.7,45,174.85crore) as against USD107.81billion (Rs.7,26,842.89crore) during the period April-July 2018-19, registering a negative growth of 0.37per cent in Dollar terms (positive growth of 2.52per cent in Rupee terms).
Non-petroleum and Non Gems and Jewellery exports in July 2019 were USD19.70billion, as compared to USD18.72billion in July 2018, exhibiting a positive growth of 5.28per cent. Non-petroleum and Non Gems and Jewellery exports in April-July 2019-20 were USD79.81billion, as compared to USD78.41billion for the corresponding period in 2018-19, an increase of 1.79per cent.
IMPORTS
Imports in July 2019 were USD39.76billion (Rs. 2,73,579.71crore), which was 10.43per cent lower in Dollar terms and 10.28per cent lower in Rupee terms over imports of USD44.39billion (Rs.3,04,916.76crore) in July 2018. Cumulative value of imports for the period April-July 2019-20 was USD166.80billion (Rs.11,57,232.64crore), as against USD173.08billion (Rs.11,67,617.41crore) during the period April-July 2018-19, registering a negative growth of 3.63per cent in Dollar terms (negative growth of 0.89per cent in Rupee terms).
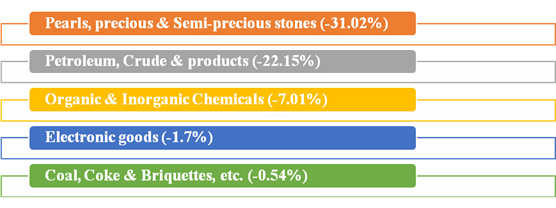
Major commodity groups of import showing negative growth in July 2019 over the corresponding month of last year are:
CRUDE OIL AND NON-OIL IMPORTS:
Oil imports inJuly 2019 were USD9.60billion (Rs. 66,056.77crore), which was 22.15 percentlower in Dollar terms (22.02percent lower in Rupee terms), compared to USD12.33billion (Rs. 84,707.59crore) in July2018. Oil imports in April-July 2019-20 were USD44.45billion (Rs. 3,08,455.32crore) which was 5.69per cent lower in Dollar terms (3.03percent lower in Rupee terms) compared to USD47.13billion (Rs. 3,18,091.98crore), over the same period last year.
In this connection it is mentioned that the global Brent price ($/bbl) has decreased by 14.02% in July 2019 vis-à-vis July 2018 as per data available from World Bank (Pink Sheet).
Non-oil imports inJuly 2019 were estimated at USD30.16 billion (Rs. 2,07,522.94crore) which was 5.92per cent lower in Dollar terms (5.76percent lower in Rupee terms), compared to USD32.06billion (Rs. 2,20,209.17crore) in July 2018. Non-oil imports in April-July 2019-20 were USD122.35billion (Rs. 8,48,777.32crore) which was 2.85per cent lower in Dollar terms (0.09percent lower in Rupee terms), compared to USD125.95 billion (Rs. 8,49,525.43crore) in April-July2018-19.
Non-Oil and Non-Gold imports wereUSD28.45billion in July 2019, recording a negative growth of 2.22per cent, as compared to Non-Oil and Non-Gold importsof USD 29.09billion in July 2018. Non-Oil and Non-Gold imports wereUSD109.19billion in April-July 2019-20, recording a negative growth of 4.67per cent, as compared to Non-Oil and Non-Gold importsUSD 114.54billion in April-July 2018-19.
II. TRADE IN SERVICES
EXPORTS (Receipts)
As per the latest press release by RBI dated 14thAugust 2019, exports in June2019 were USD 18.55 billion (Rs. 1,28,823.05 crore) registering a positive growth of 9.96per cent in dollar terms, vis-à-vis June 2018. The estimated value of services export for July 2019* is USD 18.76 billion.
IMPORTS (Payments)
As per the latest press release by RBI dated 14thAugust 2019, imports in June 2019 were USD 11.76billion (Rs. 81,646.26 crore) registering a positive growth of 14.17per cent in dollar terms, vis-à-vis June 2018. The estimated value of service Import for July 2019* is USD 11.92 billion.
III.TRADE BALANCE
MERCHANDISE: The trade deficit for July 2019 was estimated at USD13.43billion as against the deficit of USD18.63billion inJuly 2018.
SERVICES: As per RBI’s Press Release dated 14thAugust 2019, the trade balance in Services (i.e. Net Services export) for June, 2019 is estimated at USD6.79billion.
OVERALL TRADE BALANCE: Taking merchandise and services together, overall trade deficit for April-July 2019-20* is estimated at USD32.90billion as compared to USD39.38 billion in April-July 2018-19.
*Note: The latest data for services sector released by RBI is for June 2019. The data for July 2019 is an estimation, which will be revised based on RBI’s subsequent release.
MERCHANDISE TRADE
|
EXPORTS & IMPORTS : (US $ Billion)
|
|
(PROVISIONAL)
|
|
|
JULY
|
APRIL-JULY
|
|
EXPORTS(including re-exports)
|
|
|
|
2018-19
|
25.75
|
107.81
|
|
2019-20
|
26.33
|
107.41
|
|
%Growth 2019-20/ 2018-19
|
2.25
|
-0.37
|
|
IMPORTS
|
|
|
|
2018-19
|
44.39
|
173.08
|
|
2019-20
|
39.76
|
166.80
|
|
%Growth 2019-20/ 2018-19
|
-10.43
|
-3.63
|
|
TRADE BALANCE
|
|
|
|
2018-19
|
-18.63
|
-65.27
|
|
2019-20
|
-13.43
|
-59.39
|
|
|
|
|
|
EXPORTS &IMPORTS: (Rs. Crore)
|
|
|
(PROVISIONAL)
|
|
|
|
JULY
|
APRIL-JULY
|
|
EXPORTS(including re-exports)
|
|
|
|
2018-19
|
1,76,914.60
|
7,26,842.89
|
|
2019-20
|
1,81,190.34
|
7,45,174.85
|
|
%Growth 2019-20/ 2018-19
|
2.42
|
2.52
|
|
IMPORTS
|
|
|
|
2018-19
|
3,04,916.76
|
11,67,617.41
|
|
2019-20
|
2,73,579.71
|
11,57,232.64
|
|
%Growth 2019-20/ 2018-19
|
-10.28
|
-0.89
|
|
TRADE BALANCE
|
|
|
|
2018-19
|
-1,28,002.16
|
-4,40,774.52
|
|
2019-20
|
-92,389.37
|
-4,12,057.79
|
SERVICES TRADE
|
EXPORTS & IMPORTS (SERVICES) : (US $ Billion)
|
|
(PROVISIONAL)
|
June 2019
|
April-June 2019-20
|
|
EXPORTS (Receipts)
|
18.55
|
55.29
|
|
IMPORTS (Payments)
|
11.76
|
35.65
|
|
TRADE BALANCE
|
6.79
|
19.64
|
|
|
|
|
|
EXPORTS & IMPORTS (SERVICES): (Rs. Crore)
|
|
(PROVISIONAL)
|
June2019
|
April-June 2019-20
|
|
EXPORTS (Receipts)
|
1,28,823.05
|
3,84,551.99
|
|
IMPORTS (Payments)
|
81,646.26
|
2,47,967.94
|
|
TRADE BALANCE
|
47,176.79
|
1,36,584.05
|
|
Source: RBI Press Release dated 14th August 2019
|
|
Note: Services data pertains toJune 2019 as it is the latest data available as per RBI’s Press Release dated 14thAugust 2019. This data is provisional and subject to revision by RBI.
Click here for Quick Estimates
***
MM/SB