The Government has projected the real GDP growth for the year 2019-20 at 7 per cent, on the back of anticipated pickup in the growth of investment and acceleration in the growth of consumption. The Union Minister for Finance and Corporate Affairs, Smt Nirmala Sitharaman tabled the Economic Survey 2018-19 in Parliament today, which clearly stated that the year 2019-20 has delivered a huge political mandate for the government, which augurs well for the prospects of high economic growth. The April, 2019 Report of the World Economic Outlook (WEO) of International Monetary Fund (IMF) has projected India’s GDP to grow even higher at 7.3 percent in 2019. This is despite the Report projecting a decline in growth of world output and that of Emerging Market and Developing Economies (EMDEs) by 0.3 and 0.1 percentage points respectively.
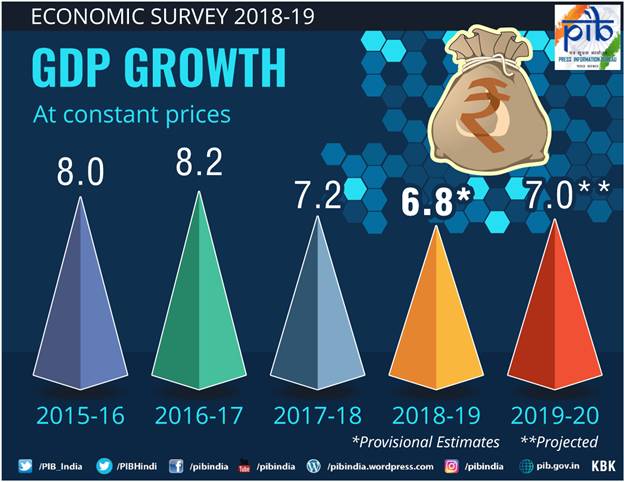
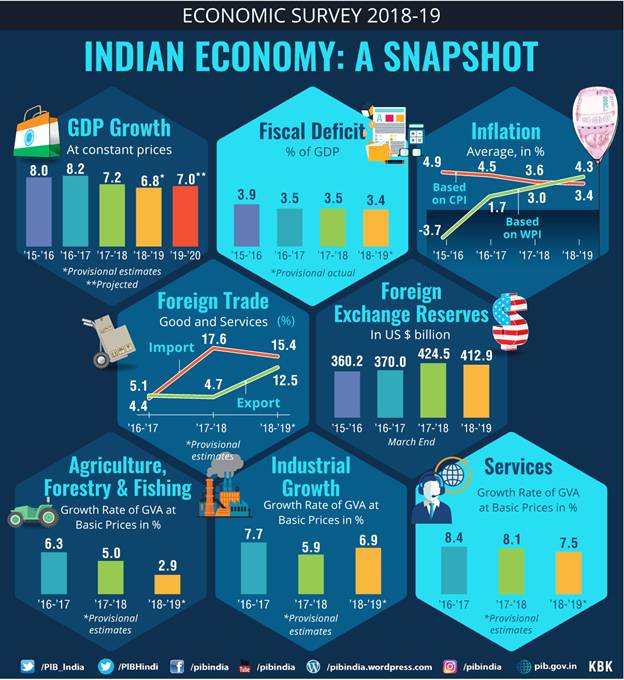
India continues to remain the fastest growing major economy in the world in 2018-19, despite a slight moderation in its GDP growth from 7.2 per cent in 2017-18 to 6.8 per cent in 2018-19. On the other hand, the world output growth declined from 3.8 per cent in 2017 to 3.6 per cent in 2018. The slowdown in the world economy and Emerging Market and Developing Economies (EMDEs) in 2018 followed the escalation of US China trade tensions, tighter credit policies in China, and financial tightening alongside the normalization of monetary policy in the larger advanced economies.
India’s growth of real GDP has been high with average growth of 7.5 per cent in the last 5 years (2014-15 onwards). The Indian economy grew at 6.8 per cent in 2018-19, thereby experiencing some moderation in growth when compared to the previous year. This moderation in growth momentum is mainly on account of lower growth in ‘Agriculture & allied’, ‘Trade, hotel, transport, storage, communication and services related to broadcasting’ and ‘Public administration & defence’ sectors. Acreage in 2018-19 for the rabi crop was marginally lower than last year, which affected agricultural performance. The contraction in food prices may have contributed to inducing farmers to produce less. On the demand side, lower growth of GDP in 2018-19 was accounted for, by a decline in growth of government final consumption, change in stocks and contraction in valuables.
On the external front, current account deficit (CAD) increased from 1.9 per cent of GDP in 2017-18 to 2.6 per cent in April-December 2018 . The widening of the CAD was largely on account of a higher trade deficit driven by rise in international crude oil prices (Indian basket). The trade deficit increased from US$ 162.1 billion in 2017-18 to US$ 184 billion 218-19. Merchandise imports reduced from 21.1 per cent to 10.4 per cent. Growth in service exports and imports in US dollar terms declined to 5.5 per cent and 6.7 per cent respectively in 2018-19, from 18.8 per cent and 22.6 per cent respectively in 2017-18.
Rupee depreciated by 7.8 per cent vis-à-vis UD dollar, 7.7 per cent against Yen, and 6.8 per cent against Euro and Pound Sterling in 2018-19. During 2018-19, Indian rupee traded with a depreciating trend against UD dollar and touched Rs. 74.4 per US dollar in October 2018 before recovering to Rs. 69.2 per US dollar at end March 2019.
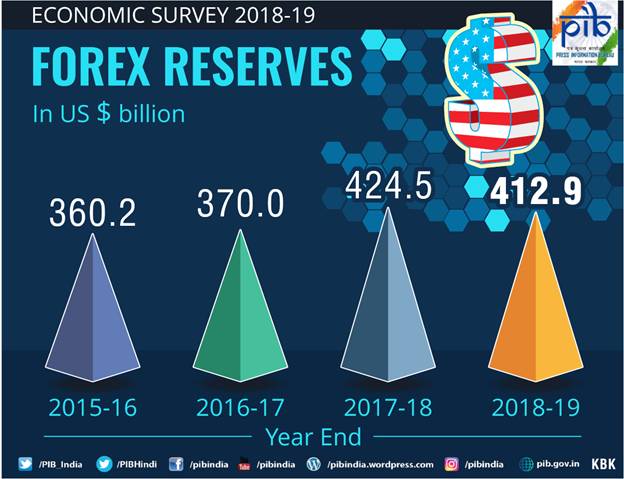
The foreign exchange reserves in nominal terms (including the valuation effects) decreased by US$ 11.6 billion end-March 2019 over end-March 2018. Within the year, foreign exchange reserves were declining until October 2018 due to RBI’s intervention to modulate exchange rate volatility. India’s foreign exchange reserves continue to be comfortably placed at US $ 422.2 billion, as on 14th June 2019.
Net Foreign Direct Investment (FDI) inflows grew by 14.2 per cent in 2018-19. Among the top sectors attracting FDI equity inflows, services, automobiles and chemicals were the major categories. By and large, FDI inflows have been growing at a high rate since 2015-16. This pick up indicates the improvement in confidence of the foreign investors in the Indian economy.
Indian banking sector has been dealing with twin balance sheet problem, which refers to stressed, corporate and bank balance sheets. The increase in Non-Performing Assets (NPA) of banks led to stress on balance sheets of banks, with the Public Sector Banks (PSBs) taking in more stress.
Consumption has always been a strong and major driver of growth in the economy. Although the share of private consumption in GDP remains high, the pattern of consumption has undergone some changes over time- from essentials to luxuries and from goods to services
Decline in investment rate and fixed investment rate since 2011-12, seems to have bottomed out with some early signs of recovery since 2017-18. Fixed investment growth picked up from 8.3 per cent in 2016-17 to 9.3 per cent in 2017-18 and further to 10.0 per cent in 2018-19. The decline in fixed investment until 2016-17 was mainly by the household sector, with fixed investment by public sector and private corporate sector remaining almost at same levels.
Green shoots in the investment activity appear to be taking hold as also seen in the pickup in credit growth to industry. Credit to, both, large and micro, small and medium enterprises has seen pickup in growth. The growth of bank credit to micro, small and medium enterprises was contracting in 2016 and 2017, but has started picking up n 2018. Credit growth to large industry started declining since March 2016 and entered negative territory by October 2016. It has recovered since early 2017-18 and the momentum has picked up in the second half of 2018.
In year 2011-12, industry sector had the highest investment rate, followed by services, whereas the agriculture sector had investment rate much less than half of that of services. In 2017-18, investment rate in services sector became the highest. Investment rate in agriculture still continues to lag behind and now is half the investment rate in the industry sector. Simultaneously, there has been a decline in savings rate as well, with the household sector entirely contributing to the decline. Household savings declined from 23.6 % in 2011-12 to 17.2 % in 2017-18.
The trend of growth of exports and imports was different in 2018-19 in rupee and US dollar terms. While growth of both export and import declined in US$ terms, it increased in rupee terms (at current prices) in 2018-19. This happened due to the depreciation of rupee vis-a vis US dollar in 2018-19.
Gross Value Added reflected a decline in economic activity, registering a growth of 6.6 per cent in 2018-19, lower than 6.9 per cent in 2017-18. Growth of net indirect taxes was 8.8 per cent in 2018-19, lower than that of 2017-18 on account of loss of momentum of economic activity.
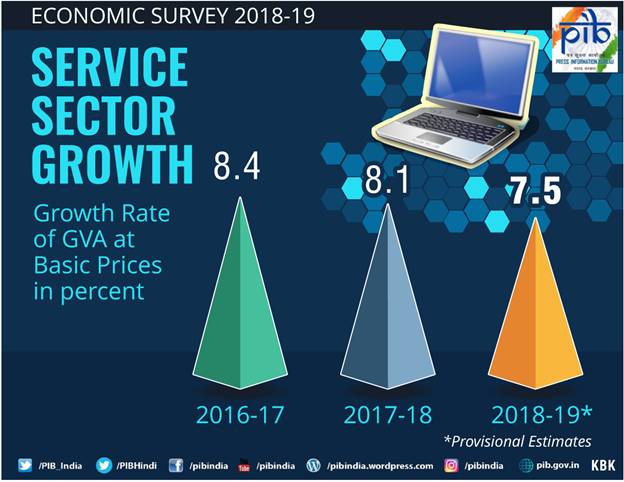
Service sector is the most dynamic sector in the economy and has remained the key driver of economic growth along with being a major contributor to GVA and export basket of the Indian Economy. Service exports has become one of the mainstay of India’s total exports increasing manifold, from Rs. 0.746 lakh crore in 2000-01 to Rs. 14.389 lakh crore in 2018-19, raising its share in total exports from 26.8 per cent to 38.4 per cent. Share of India in world service exports has also increased from 2 per cent in 2005 to 3.5 per cent in 2017. This share is much higher than that of manufacturing exports which stands at 1.8 per cent in 2017.
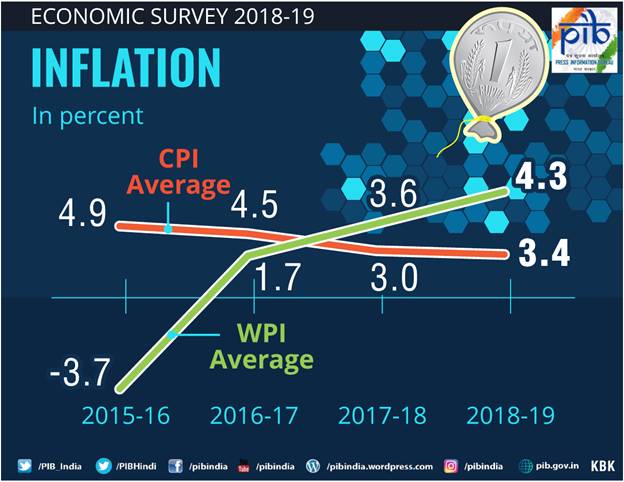
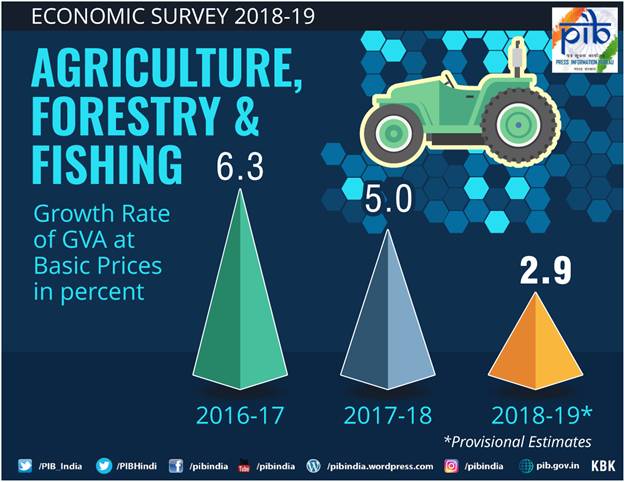
Real growth in ‘Agriculture & allied’ sector was lower in 2018-19 at 2.9 per cent, after two years of good agriculture growth. As per the 3rd Advance Estimates released by Ministry of Agriculture & Farmers Welfare, the total production of foodgrains during 2018-19 is estimated at 283.4 million tones in 2017-18 (final estimate). There was a significant decline in food prices in 2018-19 as indicated by nearly zero per cent consumer food price inflation in 2018-19 with price contraction straight for five months in the year.
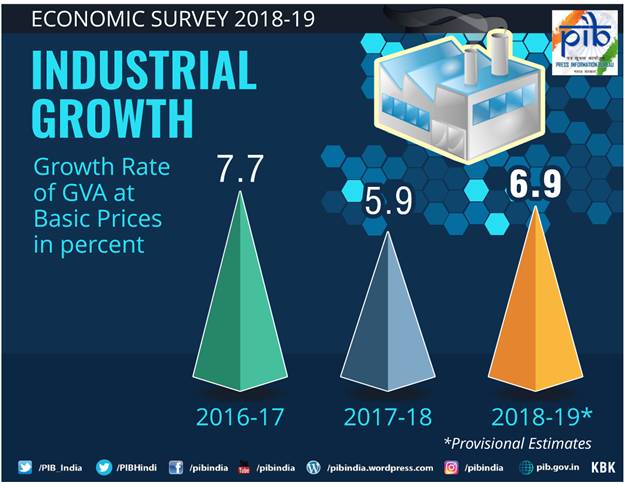
Growth in the industry accelerated during 2018-19 on the strength of improving manufacturing and construction activity, which have more than offset the declaration in the other two sub sectors, ‘Mining & quarrying’ and ‘Electricity, gas, water supply & other utility services’. Manufacturing accounted for 16.4 per cent in total GVA in 2018-19, marginally higher than that of ‘Agriculture & allied’ sector .
The growth in manufacturing sector picked up in 2018-19, although the momentum slowed down towards the end of the financial year with a growth of 3.1 per cent in fourth quarter of the year, as compared to 12.1 per cent, 6.9 per cent and 6.4 per cent in first, second and third quarter respectively. The growth rate in Q4 of 2018-19 moderated considerably, on account of lower NBFC lending, which in part led to sales in the auto sector.
Construction sector growth is estimated using growth of production of cement and consumption of finished steel. Production of cement and consumption of finished steel grew at 13.3 per cent and 7.5 per cent respectively in 2018-19, higher than their growth rates in 2017-18 and this reflects in higher growth of construction sector in 2018-19.
The ‘Financial, real estate and professional services’ sector grew at 7.4 per cent in 2018-19, higher as compared to 6.2 per cent in 2017-18. This sector amounts for more than 20 per cent of overall GVA of the economy.
***************
DSM/RM/SNC/BA