|
India's foreign Trade for April –March 2017-18
|
|
|
Merchandise (P)
|
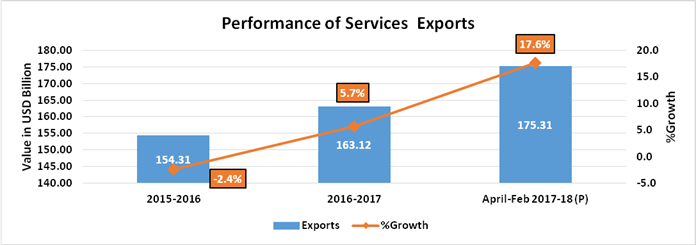
Services* (P)
|
Merchandise + Services (P)
|
|
|
Values in USD billions
|
%Growth
|
Values in USD billions
|
%Growth
|
Values in USD billions
|
|
Exports
|
302.84
|
9.78
|
175.31
|
17.63
|
478.15
|
|
Import
|
459.67
|
19.59
|
105.65
|
19.74
|
565.32
|
|
Trade Balance
|
-156.83
|
44.54
|
69.66
|
14.56
|
-87.17
|
|
Source: DGCI&S for Merchandise; for Services RBI
|
|
Note 2-Services data for 2017-18 pertains to April-Feb 2018 as Feb 2018 is the latest data available as per RBI’s Press Release.
|
|
Note 3- P : Provisionals
|


I. MERCHANDISE TRADE
EXPORTS (including re-exports)
Exports during 2017-18 are at US $ 302.84 Billion registering a growth of 9.78 per cent in dollar terms vis-à-vis 2016-17.
Exports during March 2018 were valued at US $ 29.11 Billion as compared to US $ 29.30 Billion during March 2017 exhibited negative growth of 0.66 per cent. In Rupee terms, exports were valued at Rs. 189271.16 crore as compared to Rs. 193028.91 crore during March 2017, registering a fall of 1.95 per cent.
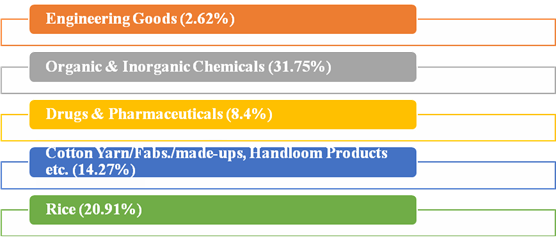
During March 2018, major commodity groups of export showing positive growth over the corresponding month of last year are

Cumulative value of exports for the period April-March 2017-18 was US $ 302.84 Billion (Rs 1952168.79 crore) as against US $ 275.85 Billion (Rs 1849428.76 crore) registering a positive growth of 9.78 per cent in Dollar terms and 5.56 per cent in Rupee terms over the same period last year.
Non-petroleum and Non Gems & Jewellery exports in March 2018 were valued at US $ 22.42 Billion as against US $ 21.44 Billion in March 2017, an increase of 4.60%. Non-petroleum and Non Gems and Jewellery exports during April-March 2017-18 were valued at US $ 222.45 Billion as compared to US $ 200.89 Billion for the corresponding period in 2016-17, an increase of 10.73%.
IMPORTS
Imports during March 2018 were valued at US $ 42.80 Billion (Rs 278296.95 crore) which was 7.15 per cent higher in Dollar terms and 5.75 per cent higher in Rupee terms over the level of imports valued at US $ 39.95 Billion (Rs. 263155.49 crore) in March 2017. Cumulative value of imports for the period April-March 2017-18 was US $ 459.67 Billion (Rs. 2962897.70 crore) as against US $ 384.36 Billion (Rs. 2577665.59 crore) registering a positive growth of 19.59 per cent in Dollar terms and 14.94 per cent in Rupee terms over the same period last year.
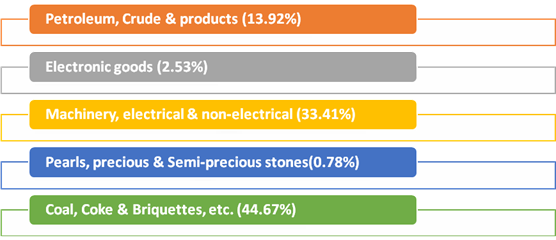
Major commodity groups of import showing high growth in March 2018 over the corresponding month of last year are:

CRUDE OIL AND NON-OIL IMPORTS:
Oil imports during March 2018 were valued at US $ 11.11 Billion which was 13.92 percent higher than oil imports valued at US $ 9.75 Billion in March 2017. Oil imports during April- March 2017-18 were valued at US $ 109.11 Billion which was 25.47 per cent higher than the oil imports of US $ 86.96 Billion in the corresponding period last year.
In this connection it is mentioned that the global Brent prices ($/bbl) have increased by 27.86 % in March 2018 vis-à-vis March 2017 as per World Bank commodity price data (The pink sheet).
Non-oil imports during March 2018 were estimated at US $ 31.69 Billion which was 4.96 per cent higher than non-oil imports of US $ 30.20 Billion in March 2017. Non-oil imports during April-March 2017-18 were valued at US $ 350.56 Billion which was 17.88 per cent higher than the level of such imports valued at US $ 297.39 Billion in April-March, 2016-17.
II. TRADE IN SERVICES (for February, 2018, as per the RBI Press Release dated 13th April 2018)
EXPORTS (Receipts)
Exports during February 2018 were valued at US $ 15.71 Billion (Rs. 101124.86 Crore) registering a negative growth of 3.84 per cent in dollar terms as compared to positive growth of 2.07 per cent during January 2018 (as per RBI’s Press Release for the respective months).
IMPORTS (Payments)
Imports during February 2018 were valued at US $ 10.14 Billion (Rs. 65294.38 Crore) registering a positive growth of 3.10 per cent in dollar terms as compared to negative growth of 0.12 per cent during January 2018 (as per RBI’s Press Release for the respective months).
III.TRADE BALANCE
MERCHANDISE: The trade deficit for March 2018 was estimated at US $ 13.69 Billion as against the deficit of US $ 10.65 Billion during March 2017.
SERVICES: As per RBI’s Press Release dated 13th April 2018, the trade balance in Services (i.e. net export of Services) for February, 2018 was estimated at US $ 5.57 Billion.
OVERALL TRADE BALANCE: Taking merchandise and services together, overall trade deficit for April-March 2017-18 is estimated at US $ 87.17 Billion as compared to US $ 47.70 Billion during April-March 2016-17. (Services data pertains to April-February 2017-18 as February 2018 is the latest data available as per RBI’s Press Release dated 13th April 2018)
MERCHANDISE TRADE
|
EXPORTS & IMPORTS: (US $ Billion)
|
|
(PROVISIONAL)
|
|
|
MARCH
|
APRIL-MARCH
|
|
EXPORTS (including re-exports)
|
|
|
|
2016-17
|
29.30
|
275.85
|
|
2017-18
|
29.11
|
302.84
|
|
%Growth 2017-18/ 2016-17
|
-0.66
|
9.78
|
|
IMPORTS
|
|
|
|
2016-17
|
39.95
|
384.36
|
|
2017-18
|
42.80
|
459.67
|
|
%Growth 2017-18/ 2016-17
|
7.15
|
19.59
|
|
TRADE BALANCE
|
|
|
|
2016-17
|
-10.65
|
-108.50
|
|
2017-18
|
-13.69
|
-156.83
|
|
EXPORTS & IMPORTS: (Rs. Crore)
|
|
(PROVISIONAL)
|
|
|
MARCH
|
APRIL-MARCH
|
|
EXPORTS(including re-exports)
|
|
|
|
2016-17
|
193028.91
|
1849428.76
|
|
2017-18
|
189271.16
|
1952168.79
|
|
%Growth 2017-18/ 2016-17
|
-1.95
|
5.56
|
|
IMPORTS
|
|
|
|
2016-17
|
263155.49
|
2577665.59
|
|
2017-18
|
278296.95
|
2962897.70
|
|
%Growth 2017-18/ 2016-17
|
5.75
|
14.94
|
|
TRADE BALANCE
|
|
|
|
2016-17
|
-70126.58
|
-728236.83
|
|
2017-18
|
-89025.79
|
-1010728.92
|
SERVICES TRADE
|
EXPORTS & IMPORTS (SERVICES) : (US $ Billion)
|
|
(Provisional)
|
February 2018
|
|
EXPORTS (Receipts)
|
15.71
|
|
IMPORTS (Payments)
|
10.14
|
|
TRADE BALANCE
|
5.57
|
|
EXPORTS & IMPORTS (SERVICES): (Rs. Crore)
|
|
(Provisional)
|
February 2018
|
|
EXPORTS (Receipts)
|
101124.86
|
|
IMPORTS (Payments)
|
65294.38
|
|
TRADE BALANCE
|
35830.48
|
|
Source: RBI Press Release dated 13th April, 2018
|
QUICK ESTIMATES FOR SELECTED MAJOR COMMODITIES FOR MARCH 2018
TRADE: EXPORT
|
Sl. No.
|
Commodities
|
(Values in Rs. crores)
|
% change
|
|
MAR'17
|
MAR'18
|
MAR'18
|
|
1
|
Tea
|
426.57
|
442.92
|
3.83
|
|
2
|
Coffee
|
714.62
|
748.02
|
4.67
|
|
3
|
Rice
|
4221.77
|
5038.40
|
19.34
|
|
4
|
Other cereals
|
91.22
|
252.45
|
176.75
|
|
5
|
Tobacco
|
612.26
|
593.24
|
-3.11
|
|
6
|
Spices
|
2214.77
|
2284.31
|
3.14
|
|
7
|
Cashew
|
613.22
|
359.11
|
-41.44
|
|
8
|
Oil Meals
|
766.63
|
427.48
|
-44.24
|
|
9
|
Oil seeds
|
846.66
|
715.58
|
-15.48
|
|
10
|
Fruits & Vegetables
|
1920.80
|
1972.90
|
2.71
|
|
11
|
Cereal preparations & miscellaneous processed items
|
768.17
|
917.23
|
19.40
|
|
12
|
Marine Products
|
3335.11
|
3676.63
|
10.24
|
|
13
|
Meat, dairy & poultry products
|
2841.53
|
2684.71
|
-5.52
|
|
14
|
Iron Ore
|
1561.31
|
1148.01
|
-26.47
|
|
15
|
Mica, Coal & Other Ores, Minerals including processed minerals
|
2869.72
|
2523.33
|
-12.07
|
|
16
|
Leather & leather products
|
2793.08
|
2863.89
|
2.54
|
|
17
|
Ceramic products & glassware
|
1160.90
|
1305.00
|
12.41
|
|
18
|
Gems & Jewellery
|
27081.60
|
22300.49
|
-17.65
|
|
19
|
Drugs & Pharmaceuticals
|
10675.66
|
11422.19
|
6.99
|
|
20
|
Organic & Inorganic Chemicals
|
9863.04
|
12826.21
|
30.04
|
|
21
|
Engineering Goods
|
52086.43
|
52754.58
|
1.28
|
|
22
|
Electronic Goods
|
3993.91
|
4539.23
|
13.65
|
|
23
|
Cotton Yarn/Fabs./made-ups, Handloom Products etc.
|
5883.91
|
6636.20
|
12.79
|
|
24
|
Man-made Yarn/Fabs./made-ups etc.
|
2890.86
|
3048.20
|
5.44
|
|
25
|
RMG of all Textiles
|
11946.37
|
9694.68
|
-18.85
|
|
26
|
Jute Mfg. including Floor Covering
|
176.95
|
161.77
|
-8.58
|
|
27
|
Carpet
|
916.43
|
819.23
|
-10.61
|
|
28
|
Handicrafts excl. handmade carpet
|
1136.93
|
1209.34
|
6.37
|
|
29
|
Petroleum Products
|
24735.26
|
21185.44
|
-14.35
|
|
30
|
Plastic & Linoleum
|
3774.06
|
4725.66
|
25.21
|
| |
Sub-Total
|
182919.75
|
179276.43
|
-1.99
|
| |
GRAND TOTAL
|
193028.91
|
189271.16
|
-1.95
|
Note: The figures for MARCH'18 and MARCH'17 are provisional and subject to change
QUICK ESTIMATES FOR SELECTED MAJOR COMMODITIES FOR MARCH 2018
TRADE: EXPORT
|
Sl. No.
|
Commodities
|
(Values in Million USD)
|
% change
|
|
MAR'17
|
MAR'18
|
MAR'18
|
|
1
|
Tea
|
64.75
|
68.12
|
5.20
|
|
2
|
Coffee
|
108.48
|
115.04
|
6.05
|
|
3
|
Rice
|
640.86
|
774.88
|
20.91
|
|
4
|
Other cereals
|
13.85
|
38.83
|
180.36
|
|
5
|
Tobacco
|
92.94
|
91.24
|
-1.83
|
|
6
|
Spices
|
336.20
|
351.32
|
4.50
|
|
7
|
Cashew
|
93.09
|
55.23
|
-40.67
|
|
8
|
Oil Meals
|
116.37
|
65.74
|
-43.51
|
|
9
|
Oil seeds
|
128.52
|
110.05
|
-14.37
|
|
10
|
Fruits & Vegetables
|
291.58
|
303.42
|
4.06
|
|
11
|
Cereal preparations & miscellaneous processed items
|
116.61
|
141.07
|
20.98
|
|
12
|
Marine Products
|
506.27
|
565.45
|
11.69
|
|
13
|
Meat, dairy & poultry products
|
431.34
|
412.90
|
-4.28
|
|
14
|
Iron Ore
|
237.00
|
176.56
|
-25.50
|
|
15
|
Mica, Coal & Other Ores, Minerals including processed minerals
|
435.62
|
388.08
|
-10.91
|
|
16
|
Leather & leather products
|
423.99
|
440.45
|
3.88
|
|
17
|
Ceramic products & glassware
|
176.22
|
200.70
|
13.89
|
|
18
|
Gems & Jewellery
|
4110.95
|
3429.72
|
-16.57
|
|
19
|
Drugs & Pharmaceuticals
|
1620.55
|
1756.68
|
8.40
|
|
20
|
Organic & Inorganic Chemicals
|
1497.20
|
1972.62
|
31.75
|
|
21
|
Engineering Goods
|
7906.65
|
8113.43
|
2.62
|
|
22
|
Electronic Goods
|
606.27
|
698.11
|
15.15
|
|
23
|
Cotton Yarn/Fabs./made-ups, Handloom Products etc.
|
893.17
|
1020.62
|
14.27
|
|
24
|
Man-made Yarn/Fabs./made-ups etc.
|
438.83
|
468.80
|
6.83
|
|
25
|
RMG of all Textiles
|
1813.44
|
1491.00
|
-17.78
|
|
26
|
Jute Mfg. including Floor Covering
|
26.86
|
24.88
|
-7.37
|
|
27
|
Carpet
|
139.11
|
125.99
|
-9.43
|
|
28
|
Handicrafts excl. handmade carpet
|
172.58
|
185.99
|
7.77
|
|
29
|
Petroleum Products
|
3754.78
|
3258.23
|
-13.22
|
|
30
|
Plastic & Linoleum
|
572.90
|
726.79
|
26.86
|
| |
Sub-Total
|
27766.98
|
27571.94
|
-0.70
|
| |
GRAND TOTAL
|
29301.55
|
29109.09
|
-0.66
|
Note: The figures for MARCH'18 and MARCH'17 are provisional and subject to change
QUICK ESTIMATES FOR SELECTED MAJOR COMMODITIES FOR MARCH 2018
TRADE: IMPORT
|
Sl. No.
|
Commodities
|
(Values in Rs. crores)
|
% change
|
|
MAR'17
|
MAR'18
|
MAR'18
|
|
1
|
Cotton Raw & Waste
|
368.09
|
347.36
|
-5.63
|
|
2
|
Vegetable Oil
|
6989.59
|
5476.87
|
-21.64
|
|
3
|
Pulses
|
2106.15
|
343.08
|
-83.71
|
|
4
|
Fruits & vegetables
|
1044.50
|
996.80
|
-4.57
|
|
5
|
Pulp and Waste paper
|
651.61
|
549.10
|
-15.73
|
|
6
|
Textile yarn Fabric, made-up articles
|
757.24
|
936.59
|
23.68
|
|
7
|
Fertilisers, Crude & manufactured
|
1109.72
|
2078.60
|
87.31
|
|
8
|
Sulphur & Unroasted Iron Pyrites
|
82.12
|
129.60
|
57.82
|
|
9
|
Metalliferous ores & other minerals
|
3035.73
|
5529.44
|
82.15
|
|
10
|
Coal, Coke & Briquettes, etc.
|
11224.45
|
16027.81
|
42.79
|
|
11
|
Petroleum, Crude & products
|
64231.88
|
72223.87
|
12.44
|
|
12
|
Wood & Wood products
|
2573.69
|
3571.56
|
38.77
|
|
13
|
Leather & leather products
|
495.24
|
526.24
|
6.26
|
|
14
|
Organic & Inorganic Chemicals
|
10520.53
|
13295.53
|
26.38
|
|
15
|
Dyeing/tanning/colouring materials.
|
1657.17
|
1608.57
|
-2.93
|
|
16
|
Artificial resins, plastic materials, etc.
|
7083.49
|
9000.62
|
27.06
|
|
17
|
Chemical material & products
|
3254.16
|
4004.36
|
23.05
|
|
18
|
Newsprint
|
501.23
|
354.93
|
-29.19
|
|
19
|
Pearls, precious & Semi-precious stones
|
19821.18
|
19716.17
|
-0.53
|
|
20
|
Iron & Steel
|
6421.86
|
8771.06
|
36.58
|
|
21
|
Non-ferrous metals
|
5732.39
|
8101.74
|
41.33
|
|
22
|
Machine tools
|
2133.77
|
2181.86
|
2.25
|
|
23
|
Machinery, electrical & non-electrical
|
16823.82
|
22153.53
|
31.68
|
|
24
|
Transport equipment
|
9027.18
|
11825.10
|
30.99
|
|
25
|
Project goods
|
1367.04
|
920.49
|
-32.67
|
|
26
|
Professional instrument, Optical goods, etc.
|
2636.27
|
3026.11
|
14.79
|
|
27
|
Electronic goods
|
31847.46
|
32230.59
|
1.20
|
|
28
|
Medicinal & Pharmaceutical products
|
2962.73
|
3180.72
|
7.36
|
|
29
|
Gold
|
27527.15
|
16218.59
|
-41.08
|
|
30
|
Silver
|
1345.07
|
1738.20
|
29.23
|
| |
Sub-Total
|
245332.51
|
267065.09
|
8.86
|
| |
GRAND TOTAL
|
263155.49
|
278296.95
|
5.75
|
Note: The figures for MARCH'18 and MARCH'17 are provisional and subject to change
QUICK ESTIMATES FOR SELECTED MAJOR COMMODITIES FOR MARCH 2018
TRADE: IMPORT
|
Sl. No.
|
Commodities
|
(Values in Million USD)
|
% change
|
|
MAR'17
|
MAR'18
|
MAR'18
|
|
1
|
Cotton Raw & Waste
|
55.88
|
53.42
|
-4.40
|
|
2
|
Vegetable Oil
|
1061.01
|
842.32
|
-20.61
|
|
3
|
Pulses
|
319.71
|
52.76
|
-83.50
|
|
4
|
Fruits & vegetables
|
158.55
|
153.30
|
-3.31
|
|
5
|
Pulp and Waste paper
|
98.91
|
84.45
|
-14.62
|
|
6
|
Textile yarn Fabric, made-up articles
|
114.95
|
144.04
|
25.31
|
|
7
|
Fertilisers, Crude & manufactured
|
168.45
|
319.68
|
89.78
|
|
8
|
Sulphur & Unroasted Iron Pyrites
|
12.47
|
19.93
|
59.82
|
|
9
|
Metalliferous ores & other minerals
|
460.82
|
850.40
|
84.54
|
|
10
|
Coal, Coke & Briquettes, etc.
|
1703.86
|
2465.01
|
44.67
|
|
11
|
Petroleum, Crude & products
|
9750.32
|
11107.72
|
13.92
|
|
12
|
Wood & Wood products
|
390.68
|
549.29
|
40.60
|
|
13
|
Leather & leather products
|
75.18
|
80.93
|
7.65
|
|
14
|
Organic & Inorganic Chemicals
|
1597.00
|
2044.80
|
28.04
|
|
15
|
Dyeing/tanning/colouring materials.
|
251.56
|
247.39
|
-1.66
|
|
16
|
Artificial resins, plastic materials, etc.
|
1075.26
|
1384.26
|
28.74
|
|
17
|
Chemical material & products
|
493.98
|
615.85
|
24.67
|
|
18
|
Newsprint
|
76.09
|
54.59
|
-28.26
|
|
19
|
Pearls, precious & Semi-precious stones
|
3008.83
|
3032.26
|
0.78
|
|
20
|
Iron & Steel
|
974.83
|
1348.95
|
38.38
|
|
21
|
Non-ferrous metals
|
870.17
|
1246.01
|
43.19
|
|
22
|
Machine tools
|
323.90
|
335.56
|
3.60
|
|
23
|
Machinery, electrical & non-electrical
|
2553.83
|
3407.12
|
33.41
|
|
24
|
Transport equipment
|
1370.31
|
1818.65
|
32.72
|
|
25
|
Project goods
|
207.51
|
141.57
|
-31.78
|
|
26
|
Professional instrument, Optical goods, etc.
|
400.18
|
465.40
|
16.30
|
|
27
|
Electronic goods
|
4834.40
|
4956.93
|
2.53
|
|
28
|
Medicinal & Pharmaceutical products
|
449.74
|
489.18
|
8.77
|
|
29
|
Gold
|
4178.59
|
2494.35
|
-40.31
|
|
30
|
Silver
|
204.18
|
267.33
|
30.93
|
| |
Sub-Total
|
37241.15
|
41073.45
|
10.29
|
| |
GRAND TOTAL
|
39946.67
|
42800.89
|
7.15
|
Note: The figures for MARCH'18 and MARCH'17 are provisional and subject to change.
***
MM/RC