- Production of Crude Oil
Crude oil production[1] during October 2021 was2512.46TMT, which is 5.95% lower than target for the monthand2.15% lowerthan the production of October2020.Cumulative crude oil production during April-October, 2021 was 17437.03TMT, which is 4.02% and 2.81% lower than target for the period and production during corresponding period of last yearrespectively. Unit-wise and State-wise crude oil production is given at Annexure-I. Unit-wise crude oil production for the month of October2021 and cumulatively for April-October2021 vis-à-vis same period of last year has been shown in Table-1 and month-wise in Figure-1.
Table-1: Crude Oil Production (in TMT)
|
Oil Company
|
Target
|
October (Month)
|
April-October (Cumulative)
|
|
2021-22 (Apr-Mar)*
|
2021-22
|
2020-21
|
% over last year
|
2021-22
|
2020-21
|
% over last year
|
|
Target*
|
Prod.*
|
Prod.
|
Target*
|
Prod.*
|
Prod.
|
|
ONGC
|
20272.88
|
1727.01
|
1641.04
|
1707.03
|
96.13
|
11844.06
|
11345.19
|
11860.92
|
95.65
|
|
OIL
|
3182.60
|
272.56
|
252.99
|
256.73
|
98.54
|
1806.86
|
1748.11
|
1742.14
|
100.34
|
|
PSC Fields
|
7718.52
|
671.95
|
618.43
|
603.98
|
102.39
|
4516.17
|
4343.72
|
4337.65
|
100.14
|
|
Total
|
31173.99
|
2671.52
|
2512.46
|
2567.74
|
97.85
|
18167.08
|
17437.03
|
17940.72
|
97.19
|
Note: Totals may not tally due to rounding off.*: Provisional
Figure-1: Monthly Crude Oil Production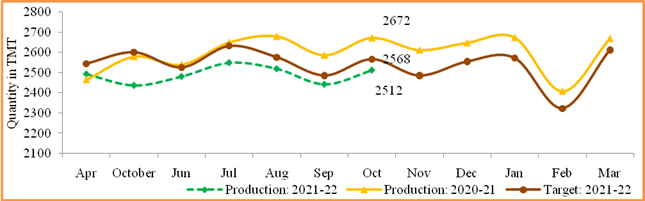
Unit-wise production details with reasons for shortfall are as under:
-
- Crude oil production by ONGC (Oil and Natural Gas Corporation) in nomination block during October 2021 was 1641.04 TMT, which is 4.98% lower than target of the month and 3.87% lower when compared with production of October 2020. Cumulative crude oil production by ONGC during April-October, 2021 was 11345.19 TMT, which is 4.21% and 4.35% lower than target for the period and production during corresponding period of last year respectively. Reasons for shortfall in production are as under:
- Less than anticipated production from WO-16 cluster due to delay in mobilization of MOPU Sagar Samrat.
- Less than anticipated production from Cluster-8 fields due to delay in inputs as installation of wellhead platforms got delayed due to Covid impact.
- Loss in oil production in Ratna& R-Series due to delay in H2S package at R-13A wells.
- Increase in water cut and decline in liquid production in Gandhar field in Ankleshwar.
-
- Crude oil production by OIL (Oil India Ltd) in the nomination block during October 2021 was 252.99 TMT, which is 7.18% lower than target of the month and 1.46% lower when compared with production of October 2020. Cumulative crude oil production by OIL during April-October 2021 was 1748.11 TMT, which is 0.34% higher than the production during corresponding period of last year but 3.25% lower than target for the period. Reasons for shortfall in production are as under:
- Less than planned contribution from workover wells and drilling wells.
- Less than planned due to local disturbance & miscreants activities in main producing area (MPA).
-
- Crude oil production by Pvt/JVs companies in the PSC/RSC regime during October 2021 was 618.43 TMT, which is 2.39% higher than the production of October 2020 but 7.97% lower than the target of the reporting month. Cumulative crude oil production by Pvt/JVs companies during April-October2021 was 4343.72 TMT, which is 0.14% higher than the production during corresponding period of last year but 3.82% lower than target for the period. Reasons for shortfall in production are as under:
- MB/OSDSF/B80/2016 (Hindustan Oil Exploration Company Ltd.): Delay in commencement of production.
- RAVVA (Cairn Energy India Ltd): Production shortfall is due to less water injection in RC-4ST and RC-11z which has caused lower production from producer wells.
- RJ-ON-90/1 (Cairn Energy India Ltd): Production shortfall due to Artificial Lift failures, well failures & Line, leakages in ABH and Bhagyam. Wells running intermittently, Pump failure and Delay in workover of few wells of Satellite fields Guda, Saraswati, NL and Raageshwari Oil. Delay in Polymer start-up in NE field.
- CB-OS/2 ((Cairn Energy India Ltd): Production shortfall is due to Natural decline, increase in water cut observed in aquifer supported pools and sanding/loading issues in the wells.
- CB-ONN-2004/2 (ONGC): Two development well in VD-3 discovery could not be drilled as planned. The production rate of new development well Vadatal#22 is not as expected.
- Production of Natural Gas
Natural gas production during October 2021 was 3016.81 MMSCM, which is 24.72% higher than the production of October 2020 but 9.37% lower than the monthly target. Cumulative natural gas production during April-October2021 was 19907.74 MMSCM, which is 21.59% higher than production during corresponding period of last year but 7.15% lower when compared with target for the period. Unit-wise and state-wise natural gas production is given at Annexure-II. Unit-wise natural gas production for the month of October 2021 and cumulatively for April-October 2021 vis-à-vis same period of last year has been shown in Table-2 and month-wise in Figure-2.
Table-2: Natural Gas Production (in MMSCM)
|
Oil Company
|
Target
|
October (Month)
|
April-October (Cumulative)
|
|
2021-22 (Apr-Mar)*
|
2021-22
|
2020-21
|
% over last year
|
2021-22
|
2020-21
|
% over last year
|
|
Target*
|
Prod.*
|
Prod.
|
Target*
|
Prod.*
|
Prod.
|
|
ONGC
|
23335.10
|
2003.47
|
1801.27
|
1883.75
|
95.62
|
13533.17
|
12057.49
|
12863.07
|
93.74
|
|
OIL
|
2949.65
|
251.06
|
266.25
|
222.48
|
119.67
|
1729.27
|
1700.56
|
1464.28
|
116.14
|
|
PSC Fields
|
11834.60
|
1074.24
|
949.29
|
312.64
|
303.63
|
6178.77
|
6149.69
|
2045.41
|
300.66
|
|
Total
|
38119.35
|
3328.76
|
3016.81
|
2418.88
|
124.72
|
21441.21
|
19907.74
|
16372.76
|
121.59
|
Note: Totals may not tally due to rounding off. *: Provisional
Figure-2: Monthly Natural Gas Production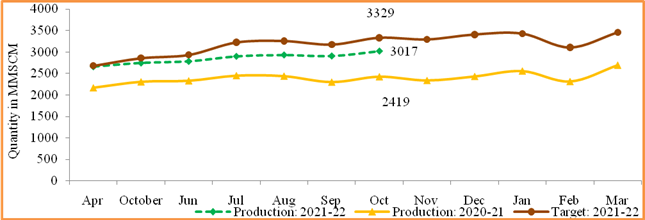
-
- Natural gas production by ONGC in the nomination blocks during October 2021 was 1801.27 MMSCM, which is 10.09% lower than target for the month and 4.38% lowerthan the production of October 2020. Cumulative natural gas production by ONGC during April-October, 2021 was 12057.49 MMSCM, which is 10.9% and 6.26% lower than target for the period and production during corresponding period of last year respectively. Reasons for shortfall in production are as under:
- Less than anticipated production from WO-16 cluster due to delay in mobilization of MOPU Sagar Samrat.
- Less than planned production from Vasistha /S1 wells in EOA due to certain reservoir related issues.
- Delay in commencement of gas production from U1 field of KG-98/2 Cluster-II due to covid impact as manufacturing of subsea items and well completion got delayed. . Now U-1-B well put on production on 28.08.2021. U-1-A well expected to put on production from Feb-22.
- Less production due to decline in Tapti-Daman block.
- Decline in production from Pasarlapudi, Adavipalem&Endamuru fields in Rajahmundry.
-
- Natural gas production by OIL in the nomination block during October 2021 was 266.25MMSCMwhich is 6.05% higher than target for the month and 19.67% higher than the production of October 2020. Cumulative natural gas production by OIL during April-October2021 was 1700.56 MMSCM, which is 19.67% higher than production during corresponding period of last year but 1.66% lower than target for the period. Major reasons for shortfall in production is less than planned contribution from drilling wells /old wells.
-
- Natural gas production by Pvt/JVs companies in the PSC/RSC/CBM regime during October 2021 was 949.29 MMSCM, which is 203.63% higher than the production of October 2020 but 11.63% lower than the target for the month. Cumulative natural gas production by Pvt/JVs during April-October 2021 was 6149.69MMSCM, which is 200.66% higher than production during corresponding period of last year but 0.47% lower than target for the period.Reasons for shortfall in production are as under:
- KG-DWN-98/2 (ONGC): Delay in commissioning of U1-A well. U1-2 (U1-B) well remained closed due to operation constraints and reservoir study.
- RJ-ON-90/1 (Cairn Energy India Ltd): Shortfall due to Planned Shutdown & Plant Trips.
- RANIGANJ EAST (Essar Oil and Gas Exploration and Production Ltd.): Shortfall on account of delay in scheduled operations due to COVID-19 pandemic.
- RJ-ON/6 (Focus Energy Ltd.): Less offtake by power plant. Some wells production got affected on account of stoppage of supplies due to tripping by the single customer of state power plant.
- MB/OSDSF/B80/2016 (Hindustan Oil Exploration Company Ltd.): Delay in commencement of production.
- Crude Oil Processed (Crude Throughput)
Crude Oil Processed during October 2021 was 20957.64 TMT, which is 6.86% higher than October 2020 and 13.97% higher than the target for the month. Cumulative crude throughput during April-October2021 was 134249.10 TMT, which is 13.24% higher than the production of corresponding period of last year but 1.73% lower than target for the period. Refinery-wise details of the crude throughput and capacity utilization during the month of October 2021 vis-à-vis October 2020 are given at Annexure-III and Annexure-IV. Company-wise crude throughput for the month of October2021 and cumulatively for the period April-October 2021vis-à-vis same period of last year has been shown in Table-3 and month-wise in Figure-3.
Figure 3: Crude Oil Processed (Crude Throughput)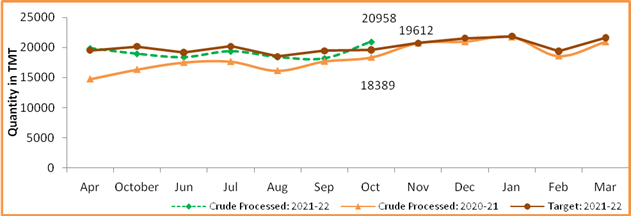
Table 3: Crude Oil Processed (Crude Throughput) (in TMT)
|
Oil Company
|
Target
|
October (Month)
|
April-October (Cumulative)
|
|
2021-22 (Apr-Mar)*
|
2021-22
|
2020-21
|
% over last year
|
2021-22
|
2020-21
|
% over last year
|
|
Target*
|
Prod.*
|
Prod.
|
Target*
|
Prod.*
|
Prod.
|
|
CPSE
|
145812.84
|
12049.21
|
11682.83
|
10763.48
|
108.54
|
82176.12
|
73945.76
|
65396.30
|
113.07
|
|
IOCL
|
70299.81
|
6043.92
|
5517.24
|
5662.06
|
97.44
|
40573.31
|
37512.83
|
32561.32
|
115.21
|
|
BPCL
|
30499.94
|
1825.00
|
2554.29
|
2116.95
|
120.66
|
17660.00
|
16278.51
|
12781.12
|
127.36
|
|
HPCL
|
17199.69
|
1579.58
|
1388.06
|
1288.87
|
107.70
|
8831.49
|
6430.85
|
9322.01
|
68.99
|
|
CPCL
|
10000.00
|
930.00
|
500.23
|
725.26
|
68.97
|
5470.00
|
4479.10
|
4108.57
|
109.02
|
|
NRL
|
2750.35
|
240.17
|
254.43
|
232.23
|
109.56
|
1580.48
|
1570.58
|
1500.61
|
104.66
|
|
MRPL
|
15000.00
|
1425.00
|
1462.98
|
731.02
|
200.13
|
8025.00
|
7632.33
|
5077.96
|
150.30
|
|
ONGC
|
63.04
|
5.53
|
5.62
|
7.10
|
79.13
|
35.83
|
41.57
|
44.70
|
92.99
|
|
JVs
|
18021.00
|
1536.00
|
1771.58
|
1599.32
|
110.77
|
10522.00
|
11675.92
|
9239.89
|
126.36
|
|
BORL
|
7000.00
|
600.00
|
658.44
|
561.14
|
117.34
|
4060.00
|
4049.18
|
3072.32
|
131.80
|
|
HMEL
|
11021.00
|
936.00
|
1113.14
|
1038.18
|
107.22
|
6462.00
|
7626.75
|
6167.58
|
123.66
|
|
Private
|
78008.07
|
6026.50
|
7503.22
|
6026.50
|
124.50
|
43919.17
|
48627.42
|
43919.17
|
110.72
|
|
RIL
|
60940.96
|
5463.71
|
5754.05
|
5463.71
|
105.31
|
34440.56
|
36848.38
|
34440.56
|
106.99
|
|
NEL
|
17067.11
|
562.79
|
1749.17
|
562.79
|
310.80
|
9478.61
|
11779.04
|
9478.61
|
124.27
|
|
TOTAL
|
241841.91
|
19611.70
|
20957.64
|
18389.30
|
113.97
|
136617.29
|
134249.10
|
118555.36
|
113.24
|
| |
|
|
|
|
|
|
|
|
|
|
Note: Totals may not tally due to rounding off. *: Provisional
3.1 CPSE Refineries’ crude oil processed during October 2021 was 11682.83 TMT, which is 8.54% higher than target for the month but3.04% lowerthan the production of October 2020. Cumulative crude throughput during April-October2021 was 73945.76 TMT which is 13.07% higher than corresponding period of last year but 10.02% lower than target for the period. Reasons for shortfall in production are as under:
- IOCL-Guwahati Refinery: Monthly Crude processed lower due to delayed Atmospheric and Vacuum Distillation Unit-1 (AVU-1) start-up.
- IOCL-Gujarat Refinery & Panipat Refinery: Monthly Crude processed lower due to lower product demand.
- IOCL-Paradip Refinery: Monthly Crude processed lower due to Continuous Catalytic Reforming Unit (CCRU) shutdown.
- BPCL-Kochi Refinery: Monthly Crude processed lower due to acid gas limitation.
- HPCL, Mumbai Refinery: Crude throughput is less due to unplanned shutdown of one of the crude processing unit.
- CPCL-Manali Refinery: Monthly Crude processed lower due to revamp activities of Hydrogen unit for RLPNG conversion, catalyst change cum reactor effluent cooler repair at site in OHCU and subsequent stabilization of units which intern led to idling of CDU-II after M&I shutdown.
3.2 JV refineries’ crude oil processed during October 2021 was 1771.58 TMT, which is 15.34% higher than the target for the month and 10.77% higher than October 2020. Cumulative crude throughput during April-October2021 was 11675.92 TMT, which is 10.97% and 26.36% higher than target for the period and production during corresponding period of last year respectively.
3.3 Private refineries’ crude oil processed during October 2021 was 7503.22 TMT, which is 24.5% higher than the corresponding month of last year. Cumulative crude throughput during April-October 2021 was 48627.42 TMT, which is 10.72% higher than the corresponding period of last year.
- Production of Petroleum Products
Production of Petroleum Products during October 2021 was 21589.72 TMT, which is 14.37% higher than production of October 2020 and9.39% higherthan target for the month. Cumulative production during April-October, 2021 was 140915.47 TMT, which is 11.69% higher when compared with the production of corresponding period of last year but 1.53% lower than target for the period. Unit-wise production of petroleum products is given at Annexure-V. Company-wise production for the month of October 2021 and cumulatively for April-October, 2021 vis-à-vis same period of last year has been shown in Table-4 and month-wise in Figure-4.
Figure 4: Monthly Refinery Production of Petroleum Products
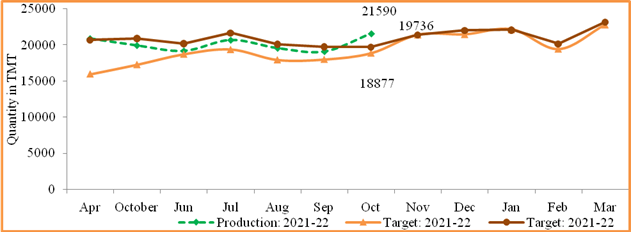
Table 4: Production of Petroleum Products (TMT)
|
Oil Company
|
Target
|
October (Month)
|
April-October (Cumulative)
|
|
2021-22 (Apr-Mar)*
|
2021-22
|
2020-21
|
% over last year
|
2021-22
|
2020-21
|
% over last year
|
|
Target*
|
Prod.*
|
Prod.
|
Target*
|
Prod.*
|
Prod.
|
|
CPSE
|
137873.44
|
11309.45
|
11029.59
|
10348.49
|
106.58
|
77725.57
|
70161.66
|
61986.66
|
113.19
|
|
IOCL
|
66984.33
|
5704.67
|
5376.68
|
5576.39
|
96.42
|
38702.67
|
36084.67
|
31265.32
|
115.41
|
|
BPCL
|
29279.04
|
1748.73
|
2338.67
|
2027.50
|
115.35
|
16919.71
|
15606.48
|
12277.93
|
127.11
|
|
HPCL
|
16019.55
|
1463.41
|
1309.74
|
1127.28
|
116.19
|
8223.96
|
6018.58
|
8666.81
|
69.44
|
|
CPCL
|
9279.11
|
864.85
|
461.97
|
701.65
|
65.84
|
5066.47
|
4071.82
|
3756.69
|
108.39
|
|
NRL
|
2749.06
|
240.06
|
254.24
|
258.82
|
98.23
|
1579.74
|
1530.78
|
1518.65
|
100.80
|
|
MRPL
|
13502.33
|
1282.45
|
1283.01
|
650.01
|
197.38
|
7198.91
|
6809.60
|
4458.40
|
152.74
|
|
ONGC
|
60.02
|
5.27
|
5.28
|
6.84
|
77.19
|
34.11
|
39.72
|
42.86
|
92.67
|
|
JVs
|
16361.00
|
1409.00
|
1674.03
|
1513.02
|
110.64
|
9650.00
|
10835.14
|
8612.19
|
125.81
|
|
BORL
|
6095.00
|
523.00
|
589.47
|
510.95
|
115.37
|
3531.00
|
3603.44
|
2659.77
|
135.48
|
|
HMEL
|
10266.00
|
886.00
|
1084.56
|
1002.07
|
108.23
|
6119.00
|
7231.69
|
5952.42
|
121.49
|
|
Private
|
93222.97
|
6652.17
|
8535.46
|
6652.17
|
128.31
|
53116.24
|
57503.30
|
53116.25
|
108.26
|
|
RIL
|
76683.16
|
6181.87
|
6903.77
|
6181.87
|
111.68
|
44025.96
|
46168.13
|
44025.96
|
104.87
|
|
NEL
|
16539.81
|
470.31
|
1631.69
|
470.31
|
346.94
|
9090.28
|
11335.17
|
9090.29
|
124.70
|
|
Total Refinery
|
247457.41
|
19370.62
|
21239.08
|
18513.68
|
114.72
|
140491.82
|
138500.09
|
123715.10
|
111.95
|
|
Fractionators
|
4516.39
|
365.72
|
350.64
|
362.89
|
96.63
|
2615.44
|
2415.37
|
2450.08
|
98.58
|
|
TOTAL
|
251973.80
|
19736.34
|
21589.72
|
18876.57
|
114.37
|
143107.26
|
140915.47
|
126165.18
|
111.69
|
| |
|
|
|
|
|
|
|
|
|
|
Note: Totals may not tally due to rounding off. *: Provisional
-
- Production of petroleum Products by Oil’s Refineries during October 2021 was 21239.08 TMT, which is 14.72% higher than production of October 2020 and9.65% higher when compared with target for the month. Cumulative production during April-October, 2021 was 138500.09 TMT, which is 11.95% higher than the production of corresponding period of last year but 1.42% lower than target for the period.
-
- Production of petroleum Products by Fractionators during October 2021 was 350.64 TMT, which is 4.12%lower than the target for the month and 3.37% higher than thetarget for the month.Cumulative production during April-October, 2021 was 2415.37 TMT, which is 7.65% and 1.42% lower than target for the period and production during corresponding period of last year respectively.
Click here to see Annexure I
Click here to see Annexure II
Click here to see Annexure III
Click here to see Annexure IV
Click here to see Annexure V
YB/RM
***********