The Government of India has set a national target of installing 1,00,000 MW grid connected solar power capacity in the country by December, 2022. As on 31.10.2019, a total grid connected solar power generation capacity of 31,696 MW has been set up in the Country, projects of 17998 MW capacity are at various stages of installations and tenders for 36278 MW capacity projects have been issued. With new tenders of around 15000 MW planned in remaining period of 2019-20 and 2020-21, we are on course for achieving the target.
The State/UT-wise solar power generation, as reported by Central Electricity Authority, in the country during each of the last three years and the current year are given in Annexure-I.
Most of the Solar power projects in the country have been/are being set up with private investment. Funds released by the Ministry under various schemes of solar power programmes in the country during last three years and current year are given below: -
|
Year
|
Total funds released (Rs. Crore)
|
|
2016-17
|
2590.59
|
|
2017-18
|
1889.93
|
|
2018-19
|
2524.65
|
|
2019-20
|
1513.49 (As on 1.10.2019)
|
While the Ministry does not make budgetary allocations state-wise, details of funds released under some of the Solar Programmes during the last three years and the current year are given in Annexure-II.
The Union Government has been implementing National Solar Mission under which various Schemes (as detailed in Annexure-III) have been launched for promoting the generation and use of solar power in the country. This apart, the Ministry of New and Renewable Energy makes publicity for effective implementation all schemes including Solar Schemes through print, social, electronic and other media. The Ministry has also launched a Mobile App for solar rooftop systems.
This information was provided by Union Minister of State (IC) New & Renewable Energy, Power and Skill Development and Entrepreneurship Shri R.K. Singh, in written reply to a question in Lok Sabha today.
ANNEXURE-I
DETAILS OF SOLAR POWER GENERATION DURING EACH OF THE LAST THREE YEARS AND
CURRENT YEAR
|
Sl.
No.
|
State/Utility
|
2016-17 (in MU)
|
2017-18 (in MU)
|
2018-19 (in MU)
|
2019-20
(in MU) (Up to
September-19)
|
|
1
|
Chandigarh
|
13.16
|
7.87
|
13.51
|
8.06
|
|
2
|
Delhi
|
5.68
|
13.41
|
10.84
|
5.70
|
|
3
|
Haryana
|
19.70
|
64.65
|
65.95
|
50.53
|
|
4
|
HP
|
0.00
|
0.00
|
0.00
|
0.00
|
|
5
|
J & K
|
0.77
|
0.00
|
0.00
|
0.00
|
|
6
|
Punjab
|
909.20
|
1432.07
|
1492.90
|
797.54
|
|
7
|
Rajasthan
|
2131.61
|
3469.25
|
4633.95
|
3390.78
|
|
8
|
Uttar Pradesh
|
230.95
|
637.02
|
1192.85
|
708.49
|
|
9
|
Uttarakhand
|
37.77
|
291.08
|
318.29
|
183.35
|
|
10
|
NTPC
Dadri/FBD/Unchahar/Singrauli/Bhadla
|
74.90
|
480.99
|
498.99
|
0.00
|
|
11
|
Oil India Ltd (Rajasthan)
|
25.59
|
25.46
|
25.18
|
0.00
|
|
12
|
Chhattisgarh
|
120.91
|
136.54
|
335.14
|
146.53
|
|
13
|
NTPC Rajgarh/Raojmal/Mandsaur
|
82.21
|
340.13
|
478.88
|
0.00
|
|
14
|
Gujarat
|
1738.28
|
2048.40
|
2410.32
|
1615.30
|
|
15
|
Madhya Pradesh
|
1366.10
|
1911.70
|
2503.41
|
1613.68
|
|
16
|
Maharashtra
|
577.83
|
1100.67
|
2206.62
|
1148.36
|
|
17
|
Dadra and Nagar Haveli
|
1.31
|
5.23
|
5.76
|
2.89
|
|
18
|
Daman & Diu
|
14.43
|
18.53
|
18.94
|
9.68
|
|
19
|
Oil India Ltd (Madhya Pradesh & Gujrat)
|
0.00
|
0.00
|
0.00
|
0.00
|
|
20
|
Andhra Pradesh
|
1599.78
|
3658.97
|
4545.80
|
2938.39
|
|
21
|
Telangana
|
1337.90
|
4013.80
|
6297.53
|
3111.23
|
|
22
|
Karnataka
|
524.67
|
2391.73
|
7575.83
|
4504.35
|
|
23
|
Kerala
|
26.52
|
55.35
|
110.84
|
62.78
|
|
24
|
NTPC Ramagundam/Anantapuram
|
350.53
|
426.37
|
434.89
|
0.00
|
|
25
|
Tamil Nadu
|
1898.34
|
2906.01
|
3554.50
|
2334.66
|
|
26
|
Lakshadweep
|
1.59
|
1.79
|
1.12
|
0.33
|
|
27
|
Punducherry
|
0.34
|
1.17
|
2.58
|
1.92
|
|
28
|
Andaman & Nicobar
|
6.17
|
6.88
|
8.04
|
6.81
|
|
29
|
Bihar
|
109.18
|
145.34
|
179.89
|
80.27
|
|
30
|
Jharkhand
|
38.47
|
19.47
|
19.14
|
8.59
|
|
31
|
Odisha
|
210.81
|
204.77
|
249.13
|
175.90
|
|
32
|
Sikkim
|
0.00
|
0.00
|
0.00
|
0.00
|
|
33
|
West Bengal
|
14.96
|
20.47
|
40.61
|
31.81
|
|
34
|
DVC
|
0.01
|
0.06
|
0.06
|
0.03
|
|
35
|
NTPC Andaman/ Talcher
|
20.00
|
20.43
|
19.71
|
0.00
|
|
36
|
Arunachal Pradesh
|
0.14
|
0.23
|
1.21
|
0.61
|
|
37
|
Assam
|
2.69
|
8.36
|
6.66
|
2.72
|
|
38
|
Manipur
|
0.01
|
0.15
|
1.88
|
1.00
|
|
39
|
Meghalaya
|
0.00
|
0.00
|
0.00
|
0.00
|
|
40
|
Mizoram
|
0.00
|
0.00
|
0.12
|
0.19
|
|
41
|
Nagaland
|
0.00
|
0.00
|
0.00
|
0.00
|
|
42
|
Tripura
|
0.00
|
0.00
|
0.00
|
2.33
|
|
43
|
NEEPCO
|
6.89
|
6.71
|
7.14
|
0.00
|
|
|
Total
|
13499.41
|
25871.07
|
39268.20
|
22944.81
|
ANNEXURE-II
STATE/UT-WISE DETAILS OF FUNDS RELEASED FOR PROMOTION OF SOLAR
ENERGY IN THE COUNTRY DURING EACH THE LAST THREE YEARS AND THE CURRENT YEAR
(I) PILOT-CUM-DEMONSTRATION PROJECT FOR DEVELOPMENT OF GRIDCONNECTED SOLAR PV POWER PLANTS ON CANAL BANKS AND CANAL TOPS
(Rs. in crore)
|
Sl.
No.
|
State
|
Implementing Agency
|
Project Details
|
Central Financial Assistance Released
|
|
|
|
|
Project Type
|
Capacity
(MW)
|
FY 201617
|
FY 201718
|
FY 201819
|
|
1
|
Andhra Pradesh
|
NREDCAP
|
CT
|
1
|
0.32
|
0.00
|
1.27
|
|
2
|
NREDCAP (APGENCO
project)
|
CB
|
5
|
1.50
|
0.00
|
4.50
|
|
3
|
Gujarat
|
SSNNL
|
CT & CB
|
10 & 15
|
10.32
|
0.00
|
31.22
|
|
4
|
Karnataka
|
KBJNL
|
CT
|
10
|
3.39
|
0.00
|
14.68
|
|
5
|
Kerala
|
KSEB
|
CT&CB
|
2 & 1
|
1.21
|
0.00
|
4.00
|
|
6
|
Punjab
|
PEDA
|
CT
|
20
|
3.00
|
0.00
|
6.15
|
|
7
|
Uttar
Pradesh
|
Irrigation
Deptt. (UP)
|
CT
|
3.5 & 2.5
|
0.00
|
0.00
|
3.26
|
|
8
|
Uttarakhand
|
UJVNL
|
CT & CB
|
1 & 19
|
6.30
|
0.00
|
17.70
|
|
9
|
West Bengal
|
WBSEDCL
|
CB
|
10
|
4.80
|
0.00
|
7.20
|
|
|
|
Total
|
CT & CB
|
50 + 50
|
30.83
|
0.00
|
90.00
|
(II) DEVELOPMENT OF SOLAR PARKS AND ULTRA MEGA SOLAR POWER PROJECTS
(Rs. in Lakh)
|
Sl.
No.
|
State
|
Solar Park
|
2016-17
|
2017-18
|
2018-19
|
2019-20
(As on 31-
10-2019)
|
|
1
|
Andhra Pradesh
|
Ananthapuramu-I Solar Park
|
9.77
|
0.00
|
0.00
|
0.00
|
|
2
|
Kurnool Solar Park
|
25.00
|
1793.81
|
0.00
|
0.00
|
|
3
|
Kadapa Solar Park
|
625.00
|
1400.00
|
3400.00
|
0.00
|
|
4
|
Ananthapuramu-II Solar Park
|
325.00
|
699.80
|
4100.00
|
0.00
|
|
5
|
Hybrid Solar Wind Park
|
0.00
|
25.00
|
0.00
|
0.00
|
|
6
|
Ext Trans PGCIL-AP-I
|
0.00
|
6000.00
|
0.00
|
4955.54
|
|
7
|
Ext Trans APTRANCO-AP II
|
0.00
|
0.00
|
2000.00
|
0.00
|
|
8
|
Ext Trans APTRANCO-Kurnool
|
0.00
|
6703.50
|
0.00
|
696.50
|
|
|
|
Sub Total
|
984.77
|
16622.11
|
9500.00
|
5652.04
|
|
9
|
Chhattisgarh
|
Rajnandgaoun Solar Park
|
15.00
|
0.00
|
0.00
|
0.00
|
|
10
|
Gujarat
|
Ext Trans PGCIL-Radhnesada
|
0.00
|
413.00
|
2387.00
|
0.00
|
|
11
|
Karnataka
|
Pavagada Solar Park
|
7980.00
|
0.00
|
0.00
|
0.00
|
|
12
|
Ext Trans PGCIL-Pavagada
|
0.00
|
4000.00
|
4000.00
|
4000.00
|
|
|
|
Sub Total
|
7995.00
|
4413.00
|
6387.00
|
4000.00
|
|
13
|
Kerala
|
Kasargod Solar Park
|
200.00
|
0.00
|
0.00
|
0.00
|
|
14
|
Madhya
Pradesh
|
Rewa Solar Park
|
0.00
|
3883.51
|
0.00
|
0.00
|
|
15
|
Neemuch-Mandsaur Solar Park
|
25.00
|
0.00
|
2523.50
|
0.00
|
|
16
|
Ext Trans PGCIL-Rewa
|
0.00
|
3000.00
|
0.00
|
3000.00
|
|
|
|
Sub Total
|
225.00
|
6883.51
|
2523.50
|
3000.00
|
|
17
|
Maharashtra
|
Sai Guru Solar Park (Pragat)
|
435.00
|
0.00
|
0.00
|
0.00
|
|
18
|
Patoda Solar Park (Paramount)
|
25.00
|
0.00
|
0.00
|
0.00
|
|
19
|
Dondaicha Solar Park
|
25.00
|
0.00
|
600.00
|
0.00
|
|
20
|
Latur Solar Park
|
0.00
|
0.00
|
10.00
|
0.00
|
|
21
|
Washim solar park
|
0.00
|
0.00
|
15.00
|
0.00
|
|
22
|
Yavatmal Solar Park
|
0.00
|
0.00
|
10.00
|
0.00
|
|
23
|
Kacharala solar park
|
0.00
|
0.00
|
15.00
|
0.00
|
|
|
|
Sub Total
|
485.00
|
0.00
|
650.00
|
0.00
|
|
24
|
Manipur
|
Bukpi Solar Park
|
0.00
|
0.00
|
0.00
|
10.00
|
|
25
|
Mizoram
|
Vankal Solar Park
|
0.00
|
0.00
|
0.00
|
10.00
|
|
26
|
Rajasthan
|
Bhadla-III Solar Park
|
450.00
|
1761.51
|
2827.65
|
0.00
|
|
27
|
Bhadla-IV Solar Park
|
1525.00
|
3600.00
|
0.00
|
0.00
|
|
28
|
Phalodi-Pokaran Solar Park
|
25.00
|
0.00
|
1800.00
|
0.00
|
|
29
|
Fatehgarh Phase-1B Solar Park
|
25.00
|
0.00
|
0.00
|
0.00
|
|
30
|
Nokh Solar Park
|
0.00
|
25.00
|
0.00
|
0.00
|
|
31
|
RVPN (Bh-II, Bh-III, Bh-IV solar parks)
|
0.00
|
5027.10
|
0.00
|
5720.00
|
|
32
|
PGCIL (Bh-II, Bh-III, Bh-IV,
Phalodi-Pokaran, Fatehgarh Ph- 1B solar parks)
|
0.00
|
3000.00
|
3000.00
|
0.00
|
|
|
|
Sub Total
|
2025.00
|
13413.61
|
7627.65
|
5720.00
|
|
Sl.
No.
|
State
|
Solar Park
|
2016-17
|
2017-18
|
2018-19
|
2019-20
(As on 31-
10-2019)
|
|
33
|
Tamil Nadu
|
Kadaladi Solar Park
|
0.00
|
0.00
|
25.00
|
0.00
|
|
34
|
Uttar Pradesh
|
Ext Trans UPPTCL
|
0.00
|
1719.15
|
0.00
|
0.00
|
|
35
|
Uttarakhand
|
Solar park in Uttarakhand
|
8.25
|
0.00
|
0.00
|
0.00
|
|
36
|
West Bengal
|
Solar park in West Bengal
|
25.00
|
0.00
|
0.00
|
0.00
|
|
|
|
Total
|
11748.02
|
43051.38
|
26713.15
|
18392.04
|
(III) FUNDS RELEASED UNDER 300 MW DEFENCE SCHEME TO DEFENCE ESTANLISHMENTS
|
SI .No
|
Year
|
Expenditure incurred
(Rs. in Crores)
|
|
1
|
2016-17
|
24.35
|
|
2
|
2017-18
|
52.36
|
|
3
|
2018-19
|
60.084
|
|
4
|
2019-20
(as on 31-10-2019)
|
8.81
|
|
|
Total
|
145.60
|
(IV) GRID CONNECTED SOLAR ROOFTOPS
(Rs. in Crore)
|
Sl. No.
|
State/UTs
|
2016-17
|
2017-18
|
2018-19
|
2019-20
|
|
Released amount
|
Released amount
|
Released amount
|
Released amount as on 25.11.2019
|
|
1
|
Andhra Pradesh
|
9.15
|
4.82
|
44.95
|
|
|
2
|
Assam
|
38.46
|
0.00
|
|
9.24
|
|
3
|
Andaman & Nicobar
|
0.53
|
7.00
|
|
|
|
4
|
Chhattisgarh
|
5.50
|
3.30
|
|
2.67
|
|
5
|
Delhi
|
19.47
|
21.40
|
|
|
|
6
|
Gujarat
|
17.43
|
23.18
|
169.19
|
12.10
|
|
7
|
Goa
|
0.00
|
0.00
|
|
|
|
8
|
Haryana
|
16.22
|
0.00
|
11.74
|
13.06
|
|
9
|
J& K
|
3.68
|
0.00
|
|
6.53
|
|
10
|
Jharkhand
|
12.71
|
0.00
|
|
|
|
11
|
Kerala
|
4.05
|
9.41
|
|
|
|
12
|
Karnataka
|
2.52
|
0.00
|
|
|
|
13
|
Lakshadweep
|
0.46
|
0.00
|
|
|
|
14
|
Madhya Pradesh
|
31.96
|
3.14
|
|
|
|
15
|
Maharashtra
|
23.18
|
0.00
|
77.13
|
|
|
16
|
Odisha
|
0.86
|
1.61
|
|
|
|
17
|
Puduchchery
|
1.10
|
0.00
|
0.10
|
|
|
18
|
Punjab
|
4.50
|
0.00
|
10.71
|
|
|
19
|
Rajasthan
|
14.79
|
11.68
|
21.36
|
|
|
20
|
Tamil Nadu
|
69.67
|
0.00
|
|
|
|
21
|
Telangana
|
20.12
|
2.72
|
18.25
|
|
|
22
|
Tripura
|
0.00
|
0.70
|
|
|
|
23
|
Uttarakhand
|
25.97
|
27.09
|
|
7.67
|
|
24
|
Uttar Pradesh
|
1.16
|
2.32
|
7.52
|
|
|
25
|
West Bengal
|
0.17
|
6.30
|
4.08
|
13.38
|
|
26
|
Chandigarh
|
6.72
|
1.73
|
18.76
|
|
|
27
|
Manipur
|
8.11
|
0.00
|
|
3.78
|
|
28
|
Himachal Pradesh
|
5.43
|
0.00
|
9.76
|
|
|
29
|
Arunachal Pradesh
|
0.00
|
14.06
|
|
|
|
30
|
Mizoram
|
0.00
|
4.54
|
|
|
|
31
|
Meghalaya
|
|
|
|
3.47
|
|
|
Sub- Total
|
343.89
|
144.99
|
393.55
|
71.89
|
|
|
|
|
|
|
|
|
32
|
PSU/Govt
Departments
|
74.74
|
16.75
|
19.67
|
20.83
|
|
33
|
SECI
|
250.00
|
3.68
|
33.56
|
81.81
|
|
34
|
NISE
|
0.00
|
2.38
|
|
|
|
35
|
TERI
|
0.00
|
0.13
|
|
|
|
36
|
others (NFDC)
|
9.38
|
0.00
|
|
|
|
|
|
|
|
|
|
|
Total
|
678.01
|
167.93
|
446.77
|
174.53
|
(V) OFF-GRID SPV SCHEME
STATE-WISE DETAILS OF FUNDS RELEASED FOR SOLAR OFF GRID APPLICATIONS FOR THE LAST THREE YEARS AND CURRENT YEAR (UPTO 31.10.2019)
(Rs. In lakhs)
|
States/UTs
|
2016-17
|
2017-18
|
2018-19
|
2019-20
|
|
Andhra Pradesh
|
3953
|
12397
|
11648
|
0
|
|
Arunachal Pradesh
|
694
|
770
|
0
|
1701
|
|
Assam
|
1358
|
981
|
0
|
1575
|
|
Bihar
|
0
|
0
|
526
|
37
|
|
Chhattisgarh
|
6549
|
15486
|
9113
|
0
|
|
Delhi
|
0
|
0
|
0
|
0
|
|
Gujarat
|
2608
|
2622
|
0
|
0
|
|
Haryana
|
0
|
0
|
65
|
0
|
|
Himachal Pradesh
|
2650
|
1339
|
1829
|
809
|
|
Jammu & Kashmir
|
2466
|
0
|
1053
|
0
|
|
Jharkhand
|
0
|
555
|
0
|
499
|
|
Karnataka
|
3901
|
0
|
1484
|
959
|
|
Kerala
|
2359
|
779
|
150
|
0
|
|
Lakshadweep
|
0
|
397
|
0
|
0
|
|
Madhya Pradesh
|
66
|
6917
|
2847
|
0
|
|
Maharashtra
|
0
|
0
|
613
|
3477
|
|
Manipur
|
442
|
652
|
0
|
1231
|
|
Meghalaya
|
1354
|
816
|
157
|
0
|
|
Mizoram
|
1354
|
1633
|
0
|
0
|
|
Nagaland
|
1501
|
884
|
206
|
1325
|
|
Odisha
|
1700
|
867
|
735
|
1017
|
|
Puducherry
|
0
|
0
|
0
|
0
|
|
Punjab
|
0
|
0
|
1323
|
713
|
|
Rajasthan
|
6711
|
8951
|
3033
|
0
|
|
Sikkim
|
282
|
0
|
274
|
0
|
|
Tamil Nadu
|
207
|
0
|
0
|
0
|
|
Telangana
|
0
|
2337
|
0
|
0
|
|
Tripura
|
1372
|
203
|
0
|
0
|
|
Uttarakhand
|
373
|
555
|
0
|
1087
|
|
Uttar Pradesh
|
1896
|
2670
|
2554
|
4517
|
|
West Bengal
|
0
|
0
|
0
|
0
|
|
Chandigarh
|
0
|
0
|
0
|
0
|
|
Others (CEL, REIL,
NABARD, Regional Rural Banks, NGOs, etc.) and other Channel
Partners
|
11266
|
26614
|
22784
|
0
|
|
Total (Rs in Lakhs)
|
55065
|
88425
|
60393
|
18945
|
(VI) VIABILITY GAP FUNDING RELEASED UNDER CPSU SCHEME AS ON 31.10.2019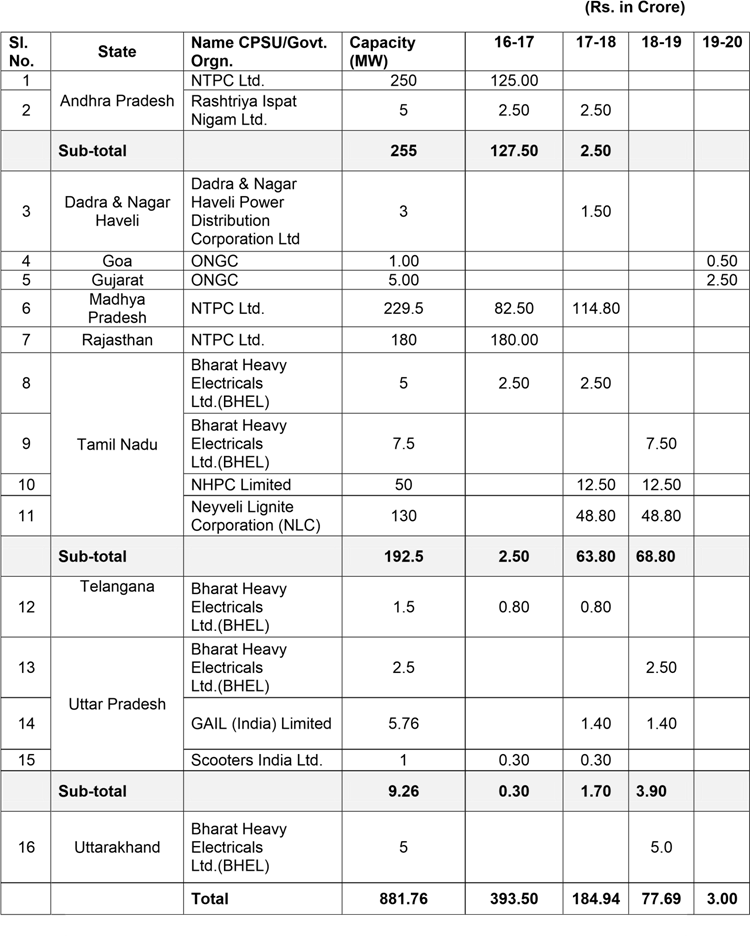
(VII) VIABILITY GAP FUNDING (VGF) RELEASED UNDER VGF SCHEME
(Rs. in Crore)
(As on 31.10.2019) (a) 750 MW
|
Sl.No.
|
States
|
Capacity (MW)
|
Financial
Year
2016-17
|
Financial
Year
2017-18
|
Financial
Year
2018-19
|
Financial
Year
2019-20
|
|
1
|
Gujarat
|
50
|
6.08
|
1.04
|
2.08
|
|
|
2
|
Karnataka
|
10
|
|
|
|
10.48
|
|
3
|
Madhya Pradesh
|
370
|
43.01
|
12.72
|
51.47
|
6.60
|
|
4
|
Maharashtra
|
45
|
1.40
|
0.67
|
11.17
|
2.70
|
|
5
|
Rajasthan
|
575
|
66.23
|
29.06
|
82.77
|
4.55
|
|
6
|
Tamilnadu
|
10
|
|
|
1.34
|
1.35
|
|
|
Total
|
1060
|
116.72
|
43.49
|
148.83
|
25.68
|
(b) 2000 MW VGF Scheme
|
Sl.No.
|
States
|
Capacity
(MW)
|
Financial Year 2018-19
|
Financial Year 2019-20
|
|
1
|
AP
|
300
|
96.87
|
96.87
|
|
2
|
Chhattisgarh
|
100
|
29.50
|
5.90
|
|
3
|
Karnataka
|
150
|
55.12
|
55.12
|
|
4
|
Maharashtra
|
270
|
53.38
|
31.23
|
|
5
|
Uttar Pradesh
|
165
|
38.74
|
31.59
|
|
|
Total
|
985
|
273.61
|
220.71
|
(c) 5000 MW VGF Scheme
|
Sl.No.
|
States
|
Capacity (MW)
|
Financial
Year
2018-19
|
Financial
Year
2019-20
|
|
1
|
Gujarat
|
250
|
191.63
|
|
|
2
|
Maharashtra
|
210
|
|
25.50
|
|
3
|
Odisha
|
270
|
|
14.77
|
|
|
Total
|
730
|
191.63
|
40.27
|
ANNEXURE-III
DETAILS OF EXISTING SCHEMES LAUNCHED UNDER NATIONAL SOLAR MISSION
- Solar Park Scheme for setting up of over 50 Solar Parks and Ultra Mega
Solar Power Projects targeting over 40,000 MW of solar power projects.
- Scheme for setting up of Grid-Connected Solar PV Power Projects by the Central Public Sector Undertakings (CPSUs) and the Government of India organisations with Viability Gap Funding (VGF).
- VGF Scheme for setting up of 5000 MW of Grid Connected Solar PV Power Projects through SECI, which has a separate component of 1000 MW for N-E states.
- Installation of Grid Connected Solar Rooftop Power Plants.
- Off-Grid Solar PV Scheme.
- Pradhan Mantri – Kisan Urja Suraksha evam Utthaan Mahabhiyan (PMKUSUM) Scheme to support farmers to set up small solar power projects and solar pumps for irrigation purpose.
**********
RCJ/RP