Ministry of Statistics & Programme Implementation
Periodic Labour Force Survey (PLFS) – Annual Report [July, 2023 – June, 2024]
प्रविष्टि तिथि:
23 SEP 2024 6:20PM by PIB Delhi
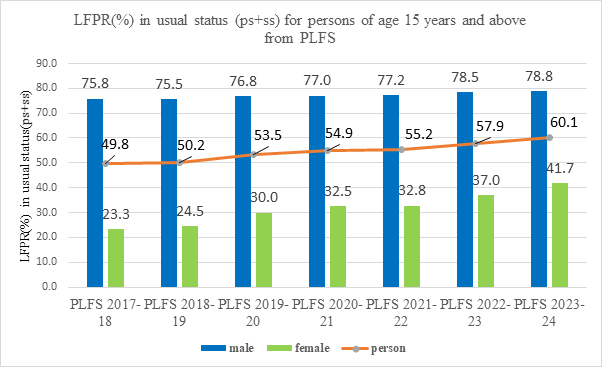
- Labour Force Participation Rate (LFPR) in usual status (ps+ss) for persons of age 15 years and above was 60.1% during July 2023 - June 2024. The same for male and female was 78.8% and 41.7% respectively.
- Overall LFPR in usual status (ps+ss) for persons of age 15 years and above has increased from 57.9% during July 2022 – June 2023 to 60.1% during July 2023 – June 2024. LFPR for female of age 15 years above in usual status (ps+ss) has increased from 37.0% during July 2022 – June 2023 to 41.7% during July 2023 – June 2024. For male of the same age group LFPR in usual status (ps+ss) increased from 78.5% to 78.8% during the same time span.
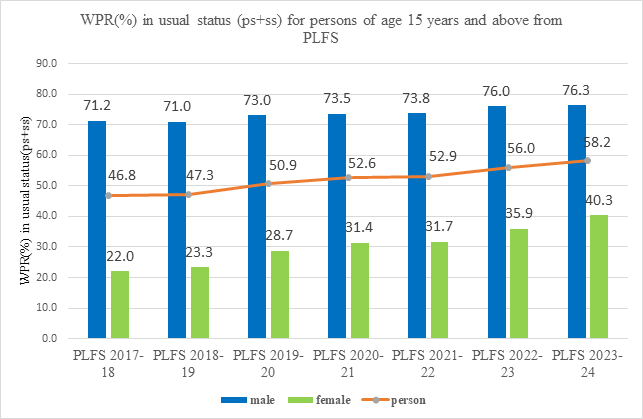
- Worker Population Ratio (WPR) in usual status (ps+ss) for persons of age 15 years and above was 58.2% during July 2023 – June 2024. The same for male and female was 76.3% and 40.3% respectively.
- WPR in usual status (ps+ss) among female of age 15 years and above has shown an increase from 35.9% during July 2022 – June 2023 to 40.3% during July 2023 – June 2024. The overall WPR among persons of the same age group in usual status (ps+ss) has increased from 56.0% during July 2022 – June 2023 to 58.2% during July 2023 – June 2024.
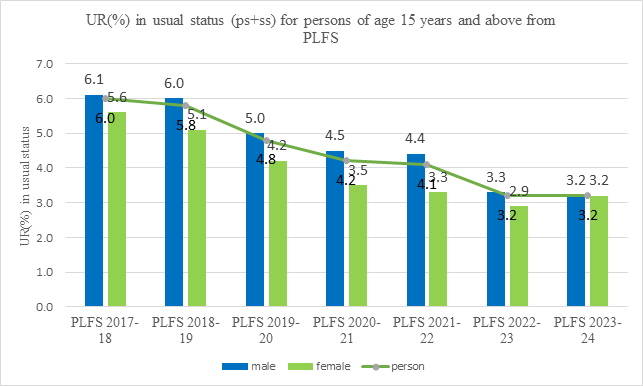
- Unemployment Rate (UR) in usual status (ps+ss) was 3.2% for both male and female of age 15 years and above during July 2023 – June 2024. While the same for male has shown a marginal decline from 3.3% during July 2022 – June 2023 to 3.2% during July 2023 – June 2024, among female it has increased from 2.9% to 3.2% during the same time span.
A. Introduction
Considering the importance of availability of labour force data at more frequent time intervals, National Sample Survey Office (NSSO) launched Periodic Labour Force Survey (PLFS) in April 2017.
The objective of PLFS is primarily twofold:
- to estimate the key employment and unemployment indicators (viz. Worker Population Ratio, Labour Force Participation Rate, Unemployment Rate) in the short time interval of three months for the urban areas only in the ‘Current Weekly Status’ (CWS).
- to estimate employment and unemployment indicators in both ‘Usual Status’ (ps+ss) and CWS in both rural and urban areas annually.
Six Annual Reports covering both rural and urban areas giving estimates of all important parameters of employment and unemployment in both usual status (ps+ss) and current weekly status (CWS) have been released. These six Annual Reports are brought out on the basis of data collected in PLFS during July 2017- June 2018, July 2018-June 2019, July 2019-June 2020, July 2020 - June 2021, July 2021-June 2022 and July 2022-June 2023.
Now the seventh Annual Report is being brought out by NSSO on the basis of Periodic Labour Force Survey conducted during July 2023-June 2024.
B. PLFS fieldwork during July 2023 – June 2024
The field work for collection of information in respect of the samples allotted for the period July 2023 – June 2024, was completed timely except for 37 first visit FSU samples (Manipur-21, Madhya Pradesh-4, Tripura-3, Punjab-2, Odisha-1, Chhattisgarh-1, Telangana-2, Maharashtra-1, Gujarat-1, Andhra Pradesh-1) and 80 revisit FSUs which were treated as casualties.
C. Sample Design of PLFS
- A rotational panel sampling design has been used in urban areas. In this rotational panel scheme, each, selected household in urban areas is visited four times, in the beginning with ‘First Visit Schedule’ and thrice periodically later with a ‘Revisit Schedule’. In urban area, samples for a panel within each stratum were drawn in the form of two independent sub-samples. The scheme of rotation ensures that 75% of the first-stage sampling units (FSUs)[1] are matched between two consecutive visits. There was no revisit in the rural samples. For rural areas, samples for a stratum/sub-stratum were drawn randomly in the form of two independent sub-samples. For rural areas, in each quarter of the survey period, 25% FSUs of annual allocation were covered.
D. Sample Size
- Sample Size for First Visit during July 2023 - June 2024 in rural and urban areas for the Annual Report: Out of the total number of 12,800 FSUs (7,016 villages and 5,784 UFS blocks) allotted for the survey at the all-India level during July 2023 - June 2024, a total of 12,743 FSUs (6,975 villages and 5,768 urban blocks) were surveyed for canvassing the PLFS schedule (Schedule 10.4). The number of households surveyed was 1,01,920 (55,796 in rural areas and 46,124 in urban areas) and number of persons surveyed was 4,18,159 (2,42,546 in rural areas and 1,75,613 in urban areas). Among the persons surveyed, total number of persons of age 15 years and above was 3,19,773 (1,80,793 in rural areas and 1,38,980 in urban areas).
- Conceptual Framework of Key Employment and Unemployment Indicators: The Periodic Labour Force Survey (PLFS) gives estimates of Key employment and unemployment Indicators like, the Labour Force Participation Rates (LFPR), Worker Population Ratio (WPR), Unemployment Rate (UR), etc. These indicators, and the ‘Usual Status’ and ‘Current Weekly Status’ are defined as follows:
- Labour Force Participation Rate (LFPR): LFPR is defined as the percentage of persons in labour force (i.e. working or seeking or available for work) in the population.
- Worker Population Ratio (WPR): WPR is defined as the percentage of employed persons in the population.
- Unemployment Rate (UR): UR is defined as the percentage of persons unemployed among the persons in the labour force.
- Activity Status- Usual Status: The activity status of a person is determined on the basis of the activities pursued by the person during the specified reference period. When the activity status is determined on the basis of the reference period of last 365 days preceding the date of survey, it is known as the usual activity status of the person.
- Principal activity status (ps) - The activity status on which a person spent relatively long time (major time criterion) during 365 days preceding the date of survey, was considered the usual principal activity status of the person.
- Subsidiary economic activity status (ss)- The activity status in which a person in addition to his/her usual principal status, performs some economic activity for 30 days or more for the reference period of 365 days preceding the date of survey, was considered the subsidiary economic activity status of the person.
- Activity Status- Current Weekly Status (CWS): The activity status determined on the basis of a reference period of last 7 days preceding the date of survey is known as the current weekly status (CWS) of the person.
The Annual Report on PLFS 2023-24 is available at the website of the Ministry (https://mospi.gov.in). The key results are given in the statements annexed.
Key Findings of PLFS, Annual Report 2023- 2024
- Estimates of key labour market indicators in usual status (ps+ss)
- Increasing Trend in Labour Force Participation Rate (LFPR) for persons of age 15 years and above
In rural areas, LFPR increased from 50.7% in 2017-18 to 63.7% in 2023-24 while for urban areas it increased from 47.6% to 52.0%. LFPR for male in India increased from 75.8% in 2017-18 to 78.8% in 2023-24 and corresponding increase in LFPR for female was from 23.3% to 41.7%.
|
|
|
Table 1: Labour Force Participation Rate (LFPR) in usual status (ps+ss) for persons of age 15 years and above
all-India
|
|
Survey period
|
Rural
|
Urban
|
Rural+Urban
|
|
male
|
female
|
person
|
male
|
female
|
person
|
male
|
female
|
person
|
|
(1)
|
(2)
|
(3)
|
(4)
|
(5)
|
(6)
|
(7)
|
(8)
|
(9)
|
(10)
|
|
2023-24
|
80.2
|
47.6
|
63.7
|
75.6
|
28.0
|
52.0
|
78.8
|
41.7
|
60.1
|
|
2022-23
|
80.2
|
41.5
|
60.8
|
74.5
|
25.4
|
50.4
|
78.5
|
37.0
|
57.9
|
|
2021-22
|
78.2
|
36.6
|
57.5
|
74.7
|
23.8
|
49.7
|
77.2
|
32.8
|
55.2
|
|
2020-21
|
78.1
|
36.5
|
57.4
|
74.6
|
23.2
|
49.1
|
77.0
|
32.5
|
54.9
|
|
2019-20
|
77.9
|
33.0
|
55.5
|
74.6
|
23.3
|
49.3
|
76.8
|
30.0
|
53.5
|
|
2018-19
|
76.4
|
26.4
|
51.5
|
73.7
|
20.4
|
47.5
|
75.5
|
24.5
|
50.2
|
|
2017-18
|
76.4
|
24.6
|
50.7
|
74.5
|
20.4
|
47.6
|
75.8
|
23.3
|
49.8
|
|
Note: (ps+ss) determined considering both principal activity status and subsidiary economic activity status
2023-24 refers to the period July 2023 – June 2024 and likewise for 2022-23, 2021-22, 2020-21, 2019-20, 2018-19 and 2017-18
|
- Increasing Trend in Worker Population Ratio (WPR) for persons of age 15 years and above
In rural areas, WPR increased from 48.1% in 2017-18 to 62.1% in 2023-24 while for urban areas it increased from 43.9% to 49.4%. WPR for male in India increased from 71.2% in 2017-18 to 76.3% in 2023-24 and corresponding increase in WPR for female was from 22.0% to 40.3%.
|
|
|
Table 2: Worker Population Ratio (WPR) in usual status (ps+ss) for persons of age 15 years and above
all-India
|
|
Indicator
|
Rural
|
Urban
|
Rural+Urban
|
|
male
|
female
|
person
|
male
|
female
|
person
|
male
|
female
|
person
|
|
(1)
|
(2)
|
(3)
|
(4)
|
(5)
|
(6)
|
(7)
|
(8)
|
(9)
|
(10)
|
|
2023-24
|
78.1
|
46.5
|
62.1
|
72.3
|
26.0
|
49.4
|
76.3
|
40.3
|
58.2
|
|
2022-23
|
78.0
|
40.7
|
59.4
|
71.0
|
23.5
|
47.7
|
76.0
|
35.9
|
56.0
|
|
2021-22
|
75.3
|
35.8
|
55.6
|
70.4
|
21.9
|
46.6
|
73.8
|
31.7
|
52.9
|
|
2020-21
|
75.1
|
35.8
|
55.5
|
70.0
|
21.2
|
45.8
|
73.5
|
31.4
|
52.6
|
|
2019-20
|
74.4
|
32.2
|
53.3
|
69.9
|
21.3
|
45.8
|
73.0
|
28.7
|
50.9
|
|
2018-19
|
72.2
|
25.5
|
48.9
|
68.6
|
18.4
|
43.9
|
71.0
|
23.3
|
47.3
|
|
2017-18
|
72.0
|
23.7
|
48.1
|
69.3
|
18.2
|
43.9
|
71.2
|
22.0
|
46.8
|
|
Note: (ps+ss) determined considering both principal activity status and subsidiary economic activity status
2023-24 refers to the period July 2023 – June 2024 and likewise for 2022-23, 2021-22, 2020-21, 2019-20, 2018-19 and 2017-18
|
- Decreasing Trend in Unemployment Rate (UR) for persons of age 15 years and above
In rural areas, UR decreased from 5.3% in 2017-18 to 2.5% in 2023-24 while for urban areas it decreased from 7.7% to 5.1%. UR for male in India decreased from 6.1% in 2017-18 to 3.2% in 2023-24 and corresponding decrease for female was from 5.6% to 3.2%.
|
|
|
Table 3: Unemployment Rate (UR) in usual status (ps+ss) for persons of age 15 years and above
all-India
|
|
Indicator
|
Rural
|
Urban
|
Rural+Urban
|
|
male
|
female
|
person
|
male
|
female
|
person
|
male
|
female
|
person
|
|
(1)
|
(2)
|
(3)
|
(4)
|
(5)
|
(6)
|
(7)
|
(8)
|
(9)
|
(10)
|
|
2023-24
|
2.7
|
2.1
|
2.5
|
4.4
|
7.1
|
5.1
|
3.2
|
3.2
|
3.2
|
|
2022-23
|
2.7
|
1.8
|
2.4
|
4.7
|
7.5
|
5.4
|
3.3
|
2.9
|
3.2
|
|
2021-22
|
3.8
|
2.1
|
3.2
|
5.8
|
7.9
|
6.3
|
4.4
|
3.3
|
4.1
|
|
2020-21
|
3.8
|
2.1
|
3.3
|
6.1
|
8.6
|
6.7
|
4.5
|
3.5
|
4.2
|
|
2019-20
|
4.5
|
2.6
|
3.9
|
6.4
|
8.9
|
6.9
|
5.0
|
4.2
|
4.8
|
|
2018-19
|
5.5
|
3.5
|
5.0
|
7.0
|
9.8
|
7.6
|
6.0
|
5.1
|
5.8
|
|
2017-18
|
5.7
|
3.8
|
5.3
|
6.9
|
10.8
|
7.7
|
6.1
|
5.6
|
6.0
|
|
Note: (ps+ss) determined considering both principal activity status and subsidiary economic activity status
2023-24 refers to the period July 2023 – June 2024 and likewise for 2022-23, 2021-22, 2020-21, 2019-20, 2018-19 and 2017-18
|
- Estimates of key labour market indicators in Current Weekly Status (CWS)
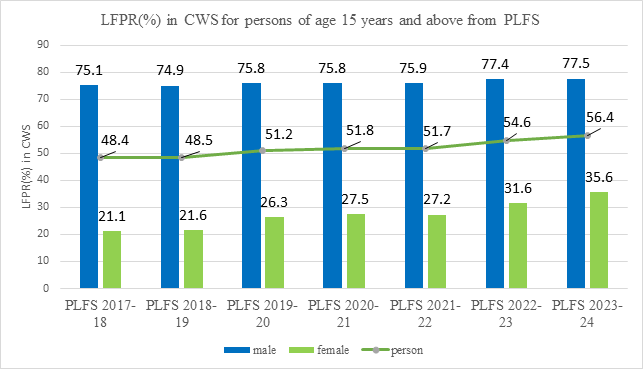
- Increasing Trend in Labour Force Participation Rate (LFPR) for persons of age 15 years and above
In rural areas, LFPR increased from 48.9% in 2017-18 to 58.9% in 2023-24 while for urban areas it increased from 47.1% to 50.8%. LFPR for male in India increased from 75.1% in 2017-18 to 77.5% in 2023-24 and corresponding increase for female was from 21.1% to 35.6%.
|
|
|
Table 4: Labour Force Participation Rate (LFPR) in current weekly status (CWS) for persons of age 15 years and above
all-India
|
|
Survey period
|
Rural
|
Urban
|
Rural+Urban
|
|
male
|
female
|
person
|
male
|
female
|
person
|
male
|
female
|
person
|
|
(1)
|
(2)
|
(3)
|
(4)
|
(5)
|
(6)
|
(7)
|
(8)
|
(9)
|
(10)
|
|
2023-24
|
78.7
|
39.7
|
58.9
|
75.0
|
26.1
|
50.8
|
77.5
|
35.6
|
56.4
|
|
2022-23
|
78.8
|
34.6
|
56.7
|
73.9
|
24.0
|
49.4
|
77.4
|
31.6
|
54.6
|
|
2021-22
|
76.7
|
29.2
|
53.0
|
74.2
|
22.1
|
48.6
|
75.9
|
27.2
|
51.7
|
|
2020-21
|
76.7
|
30.0
|
53.4
|
73.8
|
21.7
|
48.0
|
75.8
|
27.5
|
51.8
|
|
2019-20
|
76.7
|
28.3
|
52.5
|
73.8
|
22.1
|
48.2
|
75.8
|
26.3
|
51.2
|
|
2018-19
|
75.5
|
22.5
|
49.1
|
73.7
|
19.7
|
47.1
|
74.9
|
21.6
|
48.5
|
|
2017-18
|
75.6
|
21.7
|
48.9
|
74.1
|
19.6
|
47.1
|
75.1
|
21.1
|
48.4
|
|
Note: CWS: activity status determined on the basis of a reference period of last 7 days preceding the date of survey
2023-24 refers to the period July 2023 – June 2024 and likewise for 2022-23, 2021-22, 2020-21, 2019-20, 2018-19 and 2017-18
|
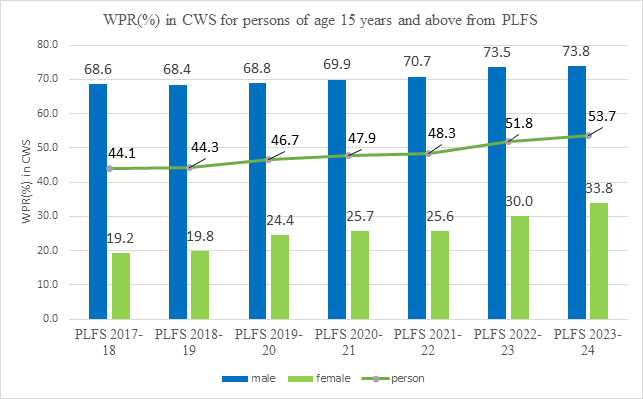
- Increasing Trend in Worker Population Ratio (WPR) for persons of age 15 years and above
In rural areas, WPR increased from 44.8% in 2017-18 to 56.5% in 2023-24 while for urban areas it increased from 42.6% to 47.4%. WPR for male in India increased from 68.6% in 2017-18 to 73.8% in 2023-24 and corresponding increase for female was from 19.2% to 33.8%.
|
|
|
Table 5: Worker Population Ratio (WPR) in current weekly status (CWS) for persons of age 15 years and above
all-India
|
|
Indicator
|
Rural
|
Urban
|
Rural+Urban
|
|
male
|
female
|
person
|
male
|
female
|
person
|
male
|
female
|
person
|
|
(1)
|
(2)
|
(3)
|
(4)
|
(5)
|
(6)
|
(7)
|
(8)
|
(9)
|
(10)
|
|
2023-24
|
75.3
|
38.1
|
56.5
|
70.5
|
23.9
|
47.4
|
73.8
|
33.8
|
53.7
|
|
2022-23
|
75.2
|
33.2
|
54.2
|
69.3
|
21.8
|
46.0
|
73.5
|
30.0
|
51.8
|
|
2021-22
|
71.7
|
27.9
|
49.9
|
68.4
|
19.9
|
44.6
|
70.7
|
25.6
|
48.3
|
|
2020-21
|
71.2
|
28.6
|
50.0
|
66.8
|
19.0
|
43.1
|
69.9
|
25.7
|
47.9
|
|
2019-20
|
70.1
|
26.7
|
48.4
|
66.0
|
19.4
|
43.0
|
68.8
|
24.4
|
46.7
|
|
2018-19
|
69.0
|
20.9
|
45.0
|
67.2
|
17.4
|
42.7
|
68.4
|
19.8
|
44.3
|
|
2017-18
|
69.1
|
20.1
|
44.8
|
67.7
|
17.1
|
42.6
|
68.6
|
19.2
|
44.1
|
|
Note: CWS: activity status determined on the basis of a reference period of last 7 days preceding the date of survey
2023-24 refers to the period July 2023 – June 2024 and likewise for 2022-23, 2021-22, 2020-21, 2019-20, 2018-19 and 2017-18
|
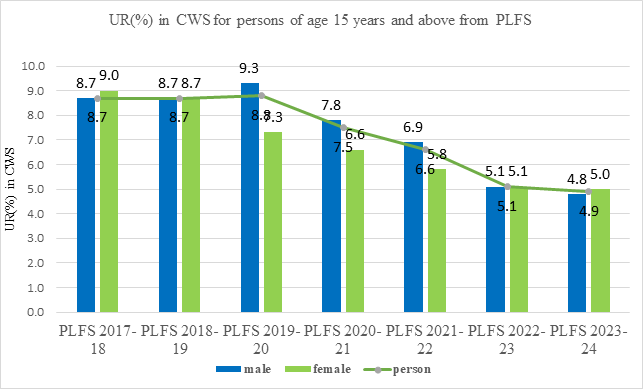
- Decreasing Trend in Unemployment Rate (UR) for persons of age 15 years and above
In rural areas, UR decreased from 8.4% in 2017-18 to 4.2% in 2023-24 while for urban areas it decreased from 9.5% to 6.7%. UR for male in India decreased from 8.7% in 2017-18 to 4.8% in 2023-24 and corresponding decrease for female was from 9.0% to 5.0%.
|
|
|
Table 6: Unemployment Rate (UR) in current weekly status (CWS) for persons of age 15 years and above
all-India
|
|
Indicator
|
Rural
|
Urban
|
Rural+Urban
|
|
male
|
female
|
person
|
male
|
female
|
person
|
male
|
female
|
person
|
|
(1)
|
(2)
|
(3)
|
(4)
|
(5)
|
(6)
|
(7)
|
(8)
|
(9)
|
(10)
|
|
2023-24
|
4.4
|
3.9
|
4.2
|
6.0
|
8.7
|
6.7
|
4.8
|
5.0
|
4.9
|
|
2022-23
|
4.6
|
4.0
|
4.4
|
6.3
|
9.1
|
7.0
|
5.1
|
5.1
|
5.1
|
|
2021-22
|
6.5
|
4.5
|
6.0
|
7.8
|
9.9
|
8.3
|
6.9
|
5.8
|
6.6
|
|
2020-21
|
7.1
|
4.8
|
6.5
|
9.4
|
12.2
|
10.1
|
7.8
|
6.6
|
7.5
|
|
2019-20
|
8.7
|
5.5
|
7.8
|
10.5
|
12.4
|
11.0
|
9.3
|
7.3
|
8.8
|
|
2018-19
|
8.6
|
7.3
|
8.3
|
8.8
|
12.1
|
9.5
|
8.7
|
8.7
|
8.7
|
|
2017-18
|
8.7
|
7.5
|
8.4
|
8.7
|
12.7
|
9.5
|
8.7
|
9.0
|
8.7
|
|
Note: CWS: activity status determined on the basis of a reference period of last 7 days preceding the date of survey
2023-24 refers to the period July 2023 – June 2024 and likewise for 2022-23, 2021-22, 2020-21, 2019-20, 2018-19 and 2017-18
|
Note: Detailed Results are available at the website of the Ministry (www.mospi.gov.in.)
*****
MG/DP
[1]Villages and urban blocks are the smallest area units taken as first-stage sampling units (FSU) in rural and urban areas respectively.
(रिलीज़ आईडी: 2057970)
आगंतुक पटल : 69194
इस विज्ञप्ति को इन भाषाओं में पढ़ें:
हिन्दी