|
Ministry of Commerce & Industry
India’s merchandise exports in Jan 2024 registers 3.12 % growth at USD 36.92 Billion over USD 35.80 Billion in Jan 2023
Main drivers of merchandise export growth in Jan 2024 include Petroleum Products, Engineering Goods, Iron Ore, Electronic Goods, Drugs & Pharmaceuticals, etc. Petroleum Products exports in Jan 2024 register growth of 6.57% at USD 8.21 Billion from USD 7.70 Billion in Jan 2023 Engineering Goods exports in Jan 2024 record an increase of 4.20% at USD 8.77 Billion over USD 8.41 Billion in Jan 2023 Electronic Goods exports register an increase of 9.31% at USD 2.30 Billion in Jan 2024 over USD 2.11 Billion in Jan 2023 Exports of Drugs and Pharmaceutical Products in Jan 2024 recorded at USD 2.13 Billion; an increase of 6.84% over USD 2.00 Billion in Jan 2023 Exports of Agricultural products including Tobacco (47.32%), Meat, Dairy & Poultry Products (26.12%), Spices (20.50%), Cereal Preparations & Miscellaneous Processed Items (18.69%), Oil Meals (14.66%), Oil Seeds (11.34%) and Fruits & Vegetables (10.61%) continue to grow in Jan 2024 Overall trade deficit improves by 37.11% from USD 111.99 Billion in April-Jan 2022-23 to USD 70.43 Billion in April-Jan 2023-24; merchandise trade deficit improves by 9.66% from USD 229.37 Billion in April-Jan 2022-23 to USD 207.20 Billion in April-Jan 2023-24
प्रविष्टि तिथि:
15 FEB 2024 4:10PM by PIB Delhi
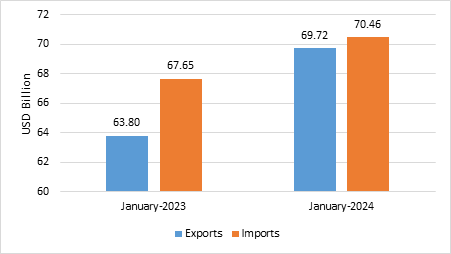
- India’s overall exports (Merchandise and Services combined) in January 2024* is estimated to be USD 69.72 Billion, exhibiting a positive growth of 9.28 per cent over January 2023. Overall imports in January 2024* is estimated to be USD 70.46 Billion, exhibiting a positive growth of 4.15 per cent over January 2023.
Table 1: Trade during January 2024*
|
|
|
January 2024
(USD Billion)
|
January 2023
(USD Billion)
|
|
Merchandise
|
Exports
|
36.92
|
35.80
|
|
Imports
|
54.41
|
52.83
|
|
Services*
|
Exports
|
32.80
|
28.00
|
|
Imports
|
16.05
|
14.83
|
|
Overall Trade
(Merchandise +Services) *
|
Exports
|
69.72
|
63.80
|
|
Imports
|
70.46
|
67.65
|
|
Trade Balance
|
-0.74
|
-3.85
|
* Note: The latest data for services sector released by RBI is for December 2023. The data for January 2024 is an estimation, which will be revised based on RBI’s subsequent release. (ii) Data for April-January 2022-23 and April-September 2023 has been revised on pro-rata basis using quarterly balance of payments data.
Fig 1: Overall Trade during January 2024*
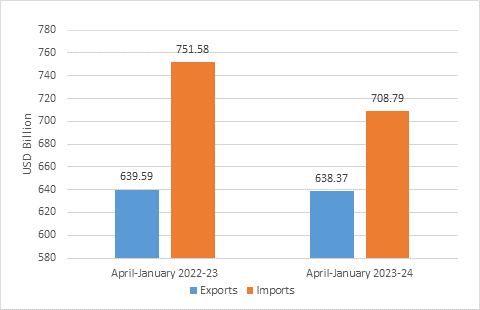
- India’s overall exports (Merchandise and Services combined) in April-January2023-24* are estimated to be USD 638.37 Billion, exhibiting a negative growth of (-) 0.19 per cent over April-January 2022-23. Overall imports in April-January 2023-24* are estimated to be USD 708.79 Billion, exhibiting a negative growth of (-) 5.69 per cent over April-January 2022-23.
Table 2: Trade during April-January 2023-24*
|
|
|
April-January 2023-24
(USD Billion)
|
April-January 2022-23
(USD Billion)
|
|
Merchandise
|
Exports
|
353.92
|
372.10
|
|
Imports
|
561.12
|
601.47
|
|
Services*
|
Exports
|
284.45
|
267.50
|
|
Imports
|
147.68
|
150.11
|
|
Overall Trade
(Merchandise+ Services)*
|
Exports
|
638.37
|
639.59
|
|
Imports
|
708.79
|
751.58
|
|
Trade Balance
|
-70.43
|
-111.99
|
Fig 2: Overall Trade during April-January 2023-24*
MERCHANDISE TRADE
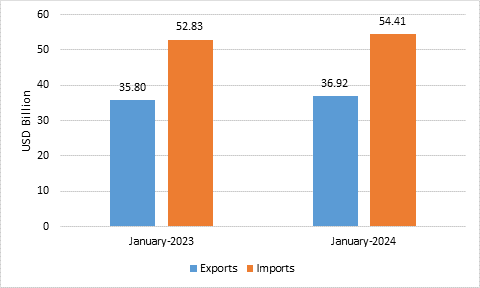
- Merchandise exports in January 2024 were USD 36.92 Billion, as compared to USD 35.80 Billion in January 2023.
- Merchandise imports in January 2024 were USD 54.41 Billion, as compared to USD 52.83 Billion in January 2023.
Fig 3: Merchandise Trade during January 2024
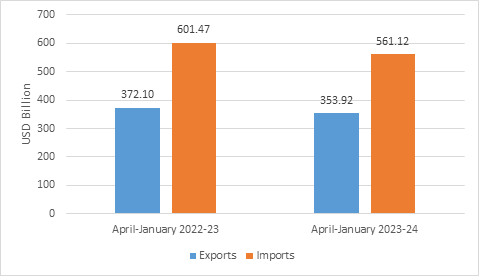
- Merchandise exports for the period April-January 2023-24 were USD 353.92 Billion as against USD 372.10 Billion during April-January 2022-23.
- Merchandise imports for the period April-January 2023-24 were USD 561.12 Billion as against USD 601.47 Billion during April-January 2022-23.
- The merchandise trade deficit for April-January 2023-24 was estimated at USD 207.20 Billion as against USD 229.37 Billion during April-January 2022-23.
Fig 4: Merchandise Trade during April-January 2023-24
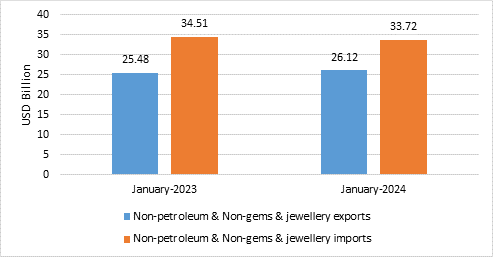
- Non-petroleum and non-gems & jewellery exports in January 2024 were USD 26.12 Billion, compared to USD 25.48 Billion in January 2023.
- Non-petroleum, non-gems & jewellery (gold, silver & precious metals) imports in January 2024 were USD 33.72 Billion, compared to USD 34.51 Billion in January 2023.
Table 3: Trade excluding Petroleum and Gems &Jewellery during January 2024
|
|
January 2024
(USD Billion)
|
January 2023
(USD Billion)
|
|
Non- petroleum exports
|
28.71
|
28.10
|
|
Non- petroleum imports
|
37.84
|
36.95
|
|
Non-petroleum & Non Gems &Jewellery exports
|
26.12
|
25.48
|
|
Non-petroleum & Non Gems &Jewellery imports
|
33.72
|
34.51
|
Note: Gems &Jewellery Imports include Gold, Silver & Pearls, precious & Semi-precious stones
Fig 5: Trade excluding Petroleum and Gems &Jewellery during January 2024
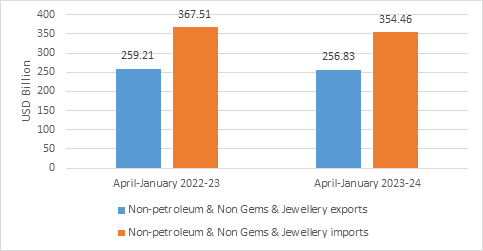
- Non-petroleum and non-gems & jewellery exports during April-January 2023-24 was USD 256.83 Billion, as compared to USD 259.21 Billion in April-January 2022-23.
- Non-petroleum, non-gems & jewellery (gold, silver & precious metals) imports were USD 354.46 Billion in April-January 2023-24 as compared to USD 367.51 Billion in April-January 2022-23.
Table 4: Trade excluding Petroleum and Gems &Jewellery during April-January 2023-24
|
|
April-January 2023-24
(USD Billion)
|
April-January 2022-23
(USD Billion)
|
|
Non- petroleum exports
|
283.72
|
290.82
|
|
Non- petroleum imports
|
414.37
|
426.95
|
|
Non-petroleum & Non Gems &Jewellery exports
|
256.83
|
259.21
|
|
Non-petroleum & Non Gems &Jewellery imports
|
354.46
|
367.51
|
Note: Gems &Jewellery Imports include Gold, Silver & Pearls, precious & Semi-precious stones
Fig 6: Trade excluding Petroleum and Gems &Jewellery during April-January 2023-24
SERVICES TRADE
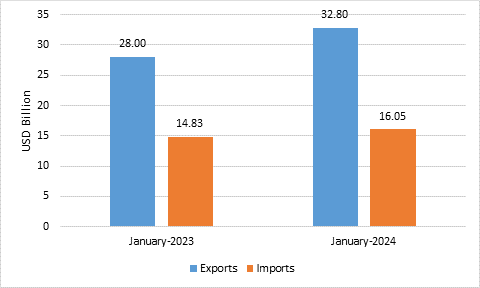
- The estimated value of services export for January 2024* is USD 32.80 Billion, as compared to USD 28.00 Billion in January 2023.
- The estimated value of services import for January 2024* is USD 16.05 Billion as compared to USD 14.83 Billion in January 2023.
Fig 7: Services Trade during January 2024*
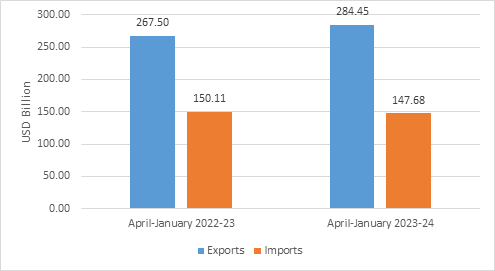
- The estimated value of services export for April-January 2023-24* is USD 284.45 Billion as compared to USD 267.50 Billion in April-January 2022-23.
- The estimated value of services imports for April-January 2023-24* is USD 147.68 Billion as compared to USD 150.11 Billion in April-January 2022-23.
- The services trade surplus for April-January 2023-24* is estimated at USD 136.77 Billion as against USD 117.38 Billion in April-January 2022-23.
Fig 8: Services Trade during April-January 2023-24*
- For the month of January 2024, undermerchandise exports, 18 of the 30 key sectors exhibited positive growth in January 2024 as compared to same period last year (January 2023). These include Iron Ore (109.79%), Tobacco (47.32%), Meat, Dairy & Poultry Products (26.12%), Spices (20.5%), Cereal Preparations & Miscellaneous Processed Items (18.69%), Oil Meals (14.66%), Oil Seeds (11.34%), Fruits & Vegetables (10.61%), Plastic & Linoleum (9.55%), Carpet (9.44%), Electronic Goods (9.31%), Tea (6.92%), Drugs & Pharmaceuticals (6.84%), Petroleum Products (6.57%), Coffee (5.53%), Engineering Goods (4.2%), Cotton Yarn/Fabs./Made-Ups, Handloom Products Etc. (2.5%) and Organic & Inorganic Chemicals (0.3%).
- Under merchandise imports, 17 out of 30 key sectors exhibited negative growth in January 2024. These include Fertilisers, Crude & Manufactured (-69.08%), Newsprint (-57.23%), Sulphur & Unroasted Iron Pyrts (-46.18%), Project Goods (-43.94%), Vegetable Oil (-38.18%), Pulp And Waste Paper (-37.96%), Cotton Raw & Waste (-32.32%), Leather & Leather Products (-28.81%), Wood & Wood Products (-21.21%), Transport Equipment (-20.6%), Organic & Inorganic Chemicals (-18.05%), Chemical Material & Products (-11.48%), Textile Yarn Fabric, Made-Up Articles (-11.24%), Artificial Resins, Plastic Materials, Etc. (-7.93%), Iron & Steel (-7.47%), Machinery, Electrical & Non-Electrical (-5.71%) and Non-Ferrous Metals (-2.12%).
- For April-January 2023-24, under merchandise exports, 14 of the 30 key sectors exhibited positive growth during April-January 2023-24 as compared to April-January 2022-23. These includeIron Ore (189.23%), Oil Meals (25.63%), Electronic Goods (20.77%), Ceramic Products & Glassware (16.52%), Fruits & Vegetables (15.76%), Tobacco (15.48%), Meat, Dairy & Poultry Products (10.42%), Oil Seeds (9.61%), Cereal Preparations & Miscellaneous Processed Items (8.14%), Drugs & Pharmaceuticals (8.07%), Spices (7.18%), Cotton Yarn/Fabs./Made-Ups, Handloom Products Etc. (5.69%), Coffee (4.35%) and Engineering Goods (0.002%).
- Under merchandise imports, 17 of the 30 key sectors exhibited negative growth in April-January 2023-24 as compared to April-January 2022-23. These include Cotton Raw & Waste (-61.57%), Silver (-44.42%), Sulphur & Unroasted Iron Pyrts (-39.85%), Fertilisers, Crude & Manufactured (-39.62%), Vegetable Oil (-28.88%), Coal, Coke & Briquettes, Etc. (-24.75%), Pearls, Precious & Semi-Precious Stones (-23.84%), Organic & Inorganic Chemicals (-20.8%), Newsprint (-17.21%), Petroleum, Crude & Products (-15.91%), Transport Equipment (-15.25%), Textile Yarn Fabric, Made-Up Articles (-14.85%), Project Goods (-14.53%), Pulp And Waste Paper (-14.36%), Wood & Wood Products (-12.26%), Leather & Leather Products (-9.27%) and Artificial Resins, Plastic Materials, Etc. (-3.56%).
- Services exports is projected to grow positively at 6.34 percent during April-January 2023-24 over April-January 2022-23.
- India’s trade deficit has shown considerable improvement in April-January 2023-24. Overall trade deficit for April-January 2023-24* is estimated at USD 70.43 Billion as compared to the deficit of USD 111.99 Billion during April-January 2022-23, registering a decline of (-) 37.11 percent. The merchandise trade deficit during April-January 2023-24is USD 207.20 Billion compared to USD 229.37 Billion during April-January 2022-23, registering a decline of (-) 9.66 percent.
*Link for Quick Estimates
***
AD/VN
(रिलीज़ आईडी: 2006282)
|