PIB Backgrounder
India’s Expanding Regional Exports
Africa and Asia lead growth across global markets
प्रविष्टि तिथि:
21 NOV 2026 12:39PM by PIB Delhi
India’s merchandise exports recorded broad-based growth across major global regions during April-September 2026-27. Exports to Africa registered the highest growth of 44%, followed by Asia at 21%. The Americas recorded 13% growth, while Europe and CIS & Baltics registered increases of 8% and 7%, respectively. Engineering goods, electronic goods and petroleum products remained important export categories. Strong performance across diverse markets and product groups reflects the expanding reach of India’s merchandise exports across global regions.
|
India’s Exports Strengthen Across Global Regions
India’s exports recorded broad-based growth across major global regions during April–September 2026-27, with Africa and Asia emerging as the fastest-growing regions.
Exports to Asia increased 21% from US$ 85.84 billion to US$ 103.84 billion, while exports to Africa surged 44% from US$ 21.87 billion to US$ 31.42 billion. The Americas registered 13% growth to US$ 66.82 billion, followed by Europe at 8% to US$ 51.04 billion and CIS & Baltics at 7% to US$ 3.36 billion.
The regional expansion was supported by demand across a diverse range of markets and export categories. Engineering goods, electronic goods, petroleum products, and chemicals featured prominently across regional export baskets.
Regional Export Performance
Asia: Exports Cross US$ 100 Billion, Led by China and Singapore
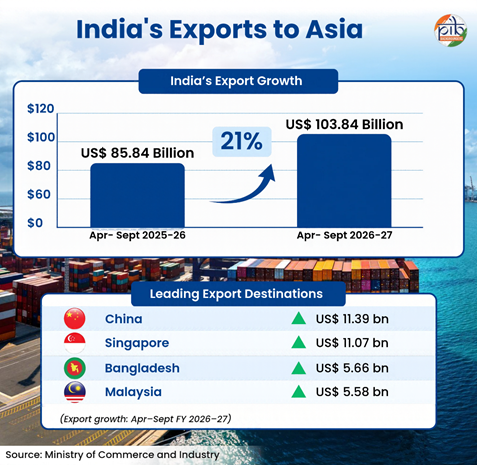
India’s exports to Asia increased 21%, from US$ 85.84 billion to US$ 103.84 billion.
Among the major export destinations:
- China and Singapore were the largest markets, with exports reaching US$ 11.39 billion and US$ 11.07 billion, respectively. Exports to China increased 36%, while those to Singapore more than doubled, registering 103% growth.
- Malaysia and Hong Kong also emerged as significant markets, with exports reaching US$ 5.58 billion and US$ 5.12 billion, respectively. Malaysia registered 83% growth, while Hong Kong recorded 37% growth.
- Other markets included Bangladesh at US$ 5.66 billion, Nepal at US$ 4.37 billion, Japan and Australia at around US$ 4.10 billion each, Sri Lanka at US$ 3.94 billion, South Korea at US$ 3.91 billion, Vietnam at US$ 3.83 billion and Oman at US$ 3.29 billion.
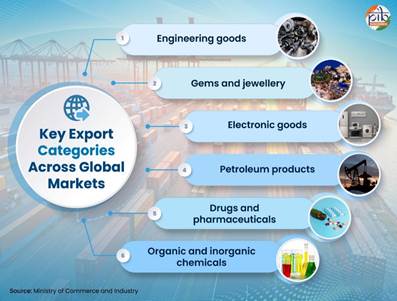
At the commodity level, engineering goods remained the largest growing category at US$ 27.47 billion, registering 22% growth. This was followed by petroleum products at US$ 17.05 billion, up 28%. Electronic goods nearly doubled to US$ 10.54 billion, growing 91%, while gems and jewellery reached US$ 9.59 billion and organic and inorganic chemicals increased to US$ 6.17 billion.
Americas: Exports Reach US$ 66.82 Billion, Driven by the US and High-Value Manufacturing
India’s exports to the Americas increased 13%, from US$ 59.30 billion to US$ 66.82 billion.
Among the major export destinations:
- United States: Accounted for US$ 50.80 billion, registering 11% growth and remaining the largest market in the region.
- Brazil, Mexico and Canada: Exports reached US$ 4.33 billion, US$ 3.45 billion and US$ 2.67 billion, respectively. Brazil registered 14% growth, Mexico 26% and Canada 18%.
- Other markets: Colombia and Chile also recorded positive growth.
The region’s growth was anchored by engineering goods at US$ 19.19 billion, up 21%, and electronic goods at US$ 15.35 billion, up 23%. Drugs and pharmaceuticals reached US$ 6.59 billion, followed by organic and inorganic chemicals at US$ 4.17 billion, gems and jewellery at US$ 3.35 billion and petroleum products at US$ 3.16 billion.
Europe: Exports Reach US$ 51 Billion, with Engineering and Electronics Leading
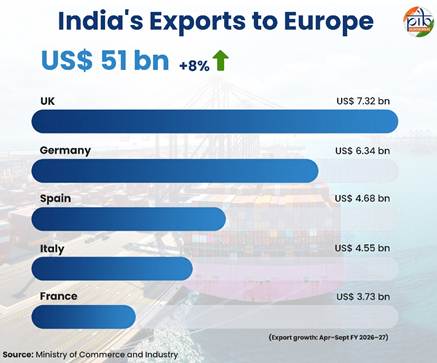
India’s exports to Europe grew 8%, from US$ 47.06 billion to US$ 51.04 billion.
Among the major export destinations:
- United Kingdom and Germany: The UK was the largest market at US$ 7.32 billion, followed by Germany at US$ 6.34 billion, with exports to Germany increasing 12%.
- Spain and Italy: Exports to Spain rose 45% to US$ 4.68 billion, while Italy recorded 25% growth to US$ 4.55 billion.
- France and Turkey: Exports to France reached US$ 3.73 billion, while those to Turkey increased 72% to US$ 3.63 billion.
Engineering goods remained the largest growing commodity category at US$ 15.88 billion, up 12%. Electronic goods rose 52% to US$ 5.44 billion, while organic and inorganic chemicals increased to US$ 4.06 billion and drugs and pharmaceuticals to US$ 3.29 billion. Gems and jewellery also grew 19% to US$ 2.20 billion.
Africa: Exports Surge to US$ 31.42 Billion, Led by Petroleum and Engineering Goods
India’s exports to Africa increased strongly by 44%, from US$ 21.87 billion to US$ 31.42 billion.
Among the major export destinations:
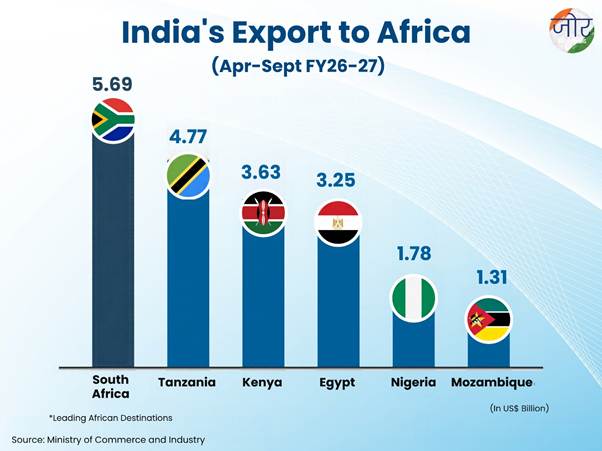
- South Africa: Remained the largest market at US$ 5.69 billion, registering 52% growth.
- Tanzania and Kenya: Exports reached US$ 4.77 billion and US$ 3.63 billion, respectively. Tanzania recorded 121% growth, while exports to Kenya more than doubled, increasing 101%.
- Egypt: Exports increased 73% to US$ 3.25 billion.
- Nigeria and Mozambique: Also recorded positive growth, reaching US$ 1.78 billion and US$ 1.31 billion, respectively.
At the commodity level, petroleum products were the largest contributor at US$ 11.85 billion, more than doubling with growth of 137%. Engineering goods reached US$ 7.48 billion, up 29%, while drugs and pharmaceuticals stood at US$ 2.58 billion. Organic and inorganic chemicals increased to US$ 1.41 billion, while plastic and linoleum and meat, dairy and poultry products also recorded strong positive growth.
CIS & Baltics: Exports Rise to US$ 3.36 Billion
India’s exports to the CIS & Baltics increased 7% from US$ 3.14 billion to US$ 3.36 billion.
Among the major export destinations:
- Russia: Remained the largest growing market, with exports rising 7% to US$ 2.39 billion.
- Georgia: Exports reached US$ 0.25 billion.
- Armenia and Kazakhstan: Also recorded positive growth.
Among growing commodity categories, organic and inorganic chemicals reached US$ 0.37 billion, up 33%. This was followed by meat, dairy and poultry products at US$ 0.36 billion, up 36%, and electronic goods at US$ 0.24 billion. Mica, coal and other ores and minerals reached US$ 0.17 billion, while marine products increased to US$ 0.14 billion.
Diversification Across Markets and Products
The regional trends underline the scale as well as growing diversification of India’s global exports. Asia remained the backbone of the export footprint at over US$ 103 billion. This was complemented by the US$ 66.82 billion Americas market and US$ 51.04 billion European market. Africa delivered particularly strong expansion to cross US$ 31 billion.
Importantly, growth was supported by large and commercially significant markets such as the United States, China, Singapore, the UK, Germany and South Africa, alongside strong expansion in Malaysia, Spain, Italy, Tanzania and Kenya.
At the product level, engineering goods, electronics and petroleum products accounted for some of the largest growing export values, pointing to a geographically and product-wise diversified expansion in India’s global merchandise exports.
Reference
Ministry of Commerce and Industry
Click here to see pdf
****
PIB Research
(रिलीज़ आईडी: 2339440)
आगंतुक पटल : 321
इस विज्ञप्ति को इन भाषाओं में पढ़ें:
Urdu