|
Ministry of Communications
“Indian Telecom Services Performance Indicator Report” for the Quarter April - June, 2026
प्रविष्टि तिथि:
12 OCT 2026 6:00PM by PIB Delhi
TRAI today has released the “Indian Telecom Services Performance Indicator Report” for the quarter ending 30th June 2026. This Report provides a broad perspective of the Telecom Services in India and presents the key parameters and growth trends of the Telecom Services as well as Cable TV, DTH & Radio Broadcasting services in India for the period covering 1st April 2026 to 30th June 2026 compiled mainly on the basis of information furnished by the Service Providers.
Executive Summary of the Report is enclosed. The complete Report is available on TRAI’s website (www.trai.gov.in and under the link http://www.trai.gov.in/release-publication/reports/performance-indicators-reports). For any suggestion or any clarification pertaining to this report, Shri Vijay Kumar, Advisor (F&EA), TRAI may be contacted on Tel. +91-20907773 and e-mail: fea1-div@trai.gov.in.
The Indian Telecom Services Performance Indicators
April–June 2026
Executive Summary
- Total number of Internet subscribers increased from 1092.79 million at the end of March 2026 to 1114.17 million at the end of June 2026, registering a quarterly rate of growth of 96%. Out of 1114.17 million Internet subscribers, number of Wired Internet subscribers are 47.73 million and number of Wireless Internet subscribers are 1066.43 million.
Composition of Internet Subscription
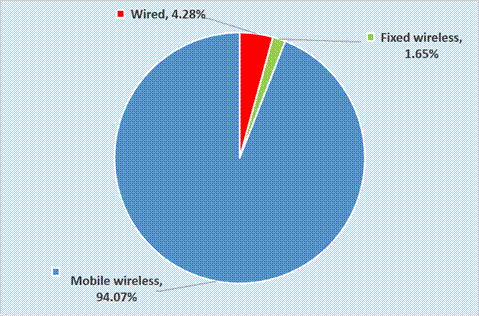
- The Internet subscriber base is comprised of Broadband Internet subscriber base of 1087.50 million and Narrowband Internet subscriber base of 26.67 million.
- The broadband Internet subscriber base increased by 2.03% from 1065.88 million at the end of March 2026 to 1087.50 million at the end of June 2026. The narrowband Internet subscriber base decreased by 0.89% from 26.91 million at the end of March 2026 to 26.67 million at the end of June 2026.
- Wireline subscribers decreased from 48.25 million at the end of March 2026 to 47.82 million at the end of June 2026 with a quarterly rate of decline 0.88%. On Y-O-Y basis, wireline subscriptions increased by 0.71% at the end of quarter ending June 2026.
- Wireline Tele-density decreased from 3.38% at the end of March 2026 to 3.35% at the end of June 2026 with quarterly rate of decline 1.06%.
- Monthly Average Revenue per User (ARPU) for wireless service increased by 1.19%, from ₹184.91 in quarter ending March 2026 to ₹187.12 in quarter ending June 2026. On Y-O-Y basis, monthly ARPU for wireless service increased by 3.11% in this quarter.
- The ARPU per month for the pre-paid segment is ₹200.72 and the ARPU per month for the post-paid segment is ₹114.26 for quarter ending June 2026.
- On an all-India average, the overall MOU per month decreased by 2.65% from 959 in quarter ending March 2026 to 933 in quarter ending June 2026.
- Prepaid MOU per subscriber is 1055 and Postpaid MOU per subscriber per month is 279 in quarter ending June 2026.
- Average revenue realization per GB for wireless data usage decreased from ₹7.51 in quarter ending March 2026 to ₹7.13 in quarter ending June 2026 with quarterly rate of decline of 5.07%.
- Number of wireless (Mobile) data subscribers has increased from 1026.75 million at the end of March 2026 to 1045.55 million at the end of June 2026 with quarterly rate of growth of 1.86%. Further, total volume of wireless (mobile) data usage also increased from 77,953 PB during quarter ending March 2026 to 84,424 PB during quarter ending June 2026 with growth of 8.30%.
- Average Wireless (Mobile) Data Usage per wireless data subscriber per month increased from 26.70 GB during quarter ending March 2026 to 28.39 GB during June 2026 with quarterly rate of growth 6.32%.
- Gross Revenue (GR), Applicable Gross Revenue (ApGR) and Adjusted Gross Revenue (AGR) of Telecom Service Sector for the quarter ending June 2026 has been ₹1,06,797 Crore, ₹101,036 crore and ₹88,796 Crore respectively. GR increased by 1.60%, ApGR by 2.43% and AGR increased by 2.40% in the quarter ending June 2025, as compared to previous quarter.
- The Y-O-Y rate of growth in GR, ApGR and AGR in the quarter ending June 2026 over the same quarter in last year have been 10.50%, 9.52% and 9.19% respectively.
- Pass Through Charges decreased from ₹12,494 Crore in the quarter ending March 2026 to ₹12,241 Crore in the quarter ending June 2026 with quarterly rate of decline of 2.02%. The Y-O-Y rate of growth 17.06% has been recorded in pass-through charges in the quarter ending June 2026.
- The License Fee increased from ₹6,936 Crore in the quarter ending March 2026 to ₹7,103 Crore in the quarter ending June 2026. The quarterly and the Y-O-Y rates of growth in license fees are 2.41% and 9.18% respectively in this quarter.
Service-wise composition of Adjusted Gross Revenue
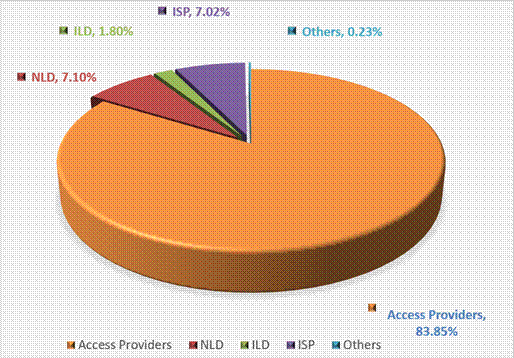
- Access services contributed 83.85% of the total Adjusted Gross Revenue of telecom services. In Access services, Gross Revenue (GR), Applicable Gross Revenue (ApGR), Adjusted Gross Revenue (AGR), License Fee, Spectrum Usage Charges (SUC) and Pass Through Charges increased by 1.43%, 2.86%, 2.72%, 2.73%, 2.83% and -8.83% respectively in the quarter ending June 2026.
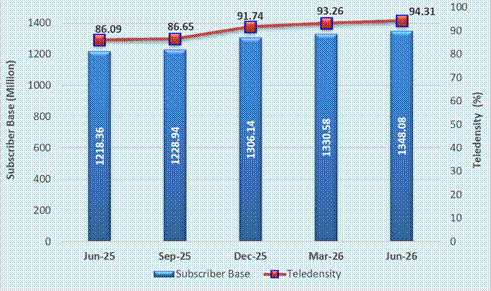
- The number of total telephone subscribers in India increased from 1,330.58 million at the end of March 2026 to 1,348.08 million at the end of June 2026, registering a rate of growth 1.31% over the previous quarter. This reflects Year-On-Year (Y-O-Y) rate of growth of 10.65% over the same quarter of last year. The overall Tele-density in India increased from 93.26% in the quarter ending March 2026 to 94.31% in the quarter ending June 2026.
Trends in Telephone subscribers and Tele-density in India
- Telephone subscribers in Urban areas increased from 778.79 million at the end of March 2026 to 792.06 million at the end of June 2026 and Urban Tele-density also increased from 151.47% to 153.43% during the same period.
- Rural telephone numbers reached 551.79 million at the end of March 2026 to 556.01 million at the end of June 2026 and Rural Tele-density also increased from 60.46% to 60.89% during the same period.
- Out of the total subscription, the share of Rural subscription decreased from 41.47% at the end of March 2026 to 41.24% at the end of June 2026.
Composition of Telephone Subscribers
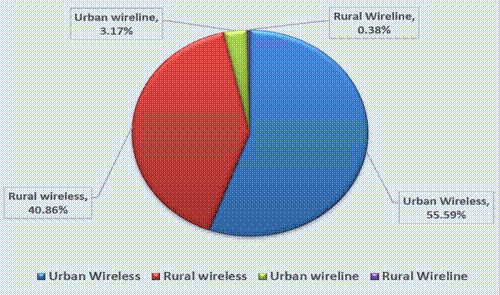
- With a net addition of 17.92 million subscribers during the quarter, the total wireless (mobile+FWA) subscriber base increased from 1282.33 million at the end of March 2026 to 1300.25 million at the end of June 2026, registering a rate of growth 1.40% over the previous quarter. On Y-O-Y basis, wireless subscriptions increased at the rate of 11.05% during the year.
- Wireless (mobile + FWA) Tele-density increased from 89.88% at the end of March 2026 to 90.96% at the end of June 2026 with quarterly rate of growth 1.21%.
- With a net addition of 16.66 million subscribers during the quarter, the wireless (mobile) subscriber base increased from 1265.73 million at the end of March 2026 to 1282.38 million at the end of June 2026, registering a rate of growth 1.32% over the previous quarter. On Y-O-Y basis, wireless subscriptions also increased at the rate of 10.26% during the year.
- Wireless (mobile) Tele-density increased from 88.71% at the end of March 2026 to 89.71% at the end of June 2026 with quarterly rate of growth of 1.13%.
- During this quarter, the following parameters in terms of QoS benchmarks have been fully complied with by all wireline service providers in all the LSAs: -
|
S. No.
|
Parameter
|
Benchmark
|
|
1
|
Fault incidences (No. of faults per 100 subscribers)
|
≤ 5
|
|
2
|
Fault repair by next working day
|
≥ 85%
|
|
3
|
Fault repair within three working days
|
≥ 99%
|
|
4
|
Mean Time-To-Repair (MTTR)
|
≤ 10 hours
|
|
5
|
Point of Interconnection (POI) Congestion (90th percentile value)
|
≤ 0.5%
|
|
6
|
Billing and charging complaints
|
≤ 0.1%
|
|
7
|
Resolution of billing/ charging complaints within four weeks
|
100%
|
|
8
|
Application of adjustment to customer’s account within one week from the date of resolution of billing and charging complaints or rectification of faults or rectification of significant network outage, as applicable
|
100%
|
|
9
|
Accessibility of call centre/ customer care
|
≥ 95%
|
|
10
|
Percentage of calls answered by the operators (voice to voice) within 90 seconds
|
≥ 95%
|
|
11
|
Termination/ closure of service within seven working days of receipt of customer’s request
|
100%
|
- During this quarter, list of QoS parameters which are fully complied with by all the Access Service (Wireless) providers in all the LSAs: -
|
S. No.
|
Parameter
|
Benchmark
|
|
1
|
Availability of service wise geospatial coverage map on service provider’s website for percentage of working cells
|
≥ 99%
|
|
2
|
Cumulative downtime (Cells not available for service)
|
≤ 1.5 %
|
|
3
|
Worst Affected Cells due to downtime
|
≤ 1.5 %
|
|
4
|
Percentage of significant network outage (services not available in a district for more than 4 hours) reported to the Authority within 24 hrs of start of the outage
|
100%
|
|
5
|
Call Set-up Success Rate: Intra- Service provider (within service provider’s network)
|
≥ 98%
|
|
6
|
Call Set-up Success Rate: Inter- Service provider (incoming from other service providers' network)
|
≥ 95%
|
|
7
|
Point of Interconnection (POI) Congestion (90th percentile value)
|
≤ 0.5%
|
|
8
|
DCR Spatial Distribution Measure for Circuit Switched (2G/3G) network [CS_QSD (88, 88)]
|
≤ 2%
|
|
9
|
DCR Spatial Distribution Measure for Packet Switched (4G/5G and beyond) network
[PS_QSD (93, 93)]
|
≤ 2%
|
|
10
|
Downlink Packet Drop Rate for Packet Switched Network (4G/5G and beyond) [DLPDR_QSD (88, 88)]
|
≤ 2%
|
|
11
|
Uplink Packet Drop Rate for Packet Switched Network (4G/5G and beyond) [ULPDR_QSD (88, 88)]
|
≤ 2%
|
|
12
|
Latency (in 4G and 5G network)
|
≤ 75 msec
|
|
13
|
Packet Drop Rate (in 4G and 5G network)
|
≤ 3%
|
|
14
|
Percentile value of measured test samples for which download and upload speed is ≥ offered typical download and upload speed in tariff offerings
|
80th percentile
|
|
15
|
Billing and charging complaints
|
≤ 0.1%
|
|
16
|
Resolution of billing/ charging complaints within four weeks
|
100%
|
|
17
|
Application of adjustment to customer’s account within one week from the date of resolution of billing and charging complaints or rectification of faults or rectification of significant network outage, as applicable
|
100%
|
|
18
|
Accessibility of call centre/ customer care
|
≥ 95%
|
|
19
|
Percentage of calls answered by the operators (voice to voice) within 90 seconds
|
≥ 95%
|
|
20
|
Termination/ closure of service within seven working days of receipt of customer’s request
|
100%
|
|
21
|
Refund of deposits within 45 days of closure of service or non-provisioning of service
|
100%
|
- List of QoS parameters which are fully complied with by all the Broadband (Wireline) Service providers in all the service areas: -
|
S. No.
|
Parameter
|
Benchmark
|
|
1.
|
Latency
|
≤ 50 msec
|
|
2.
|
Packet Drop Rate
|
≤ 1%
|
|
3.
|
Percentile value of measured test samples for which download and upload speed is ≥ offered typical download and upload speed in tariff offerings
|
90th percentile
|
|
4.
|
Jitter
|
≤ 40ms
|
|
5.
|
Fault incidences (No. of faults per 100 subscribers)
|
≤ 5
|
|
6.
|
Fault repair by next working day
|
≥ 85%
|
|
7.
|
Fault repair within three working days
|
≥ 99%
|
|
8.
|
Billing and charging complaints
|
≤ 0.1%
|
|
9.
|
Resolution of billing/ charging complaints within four weeks
|
100%
|
|
10
|
Accessibility of call centre/ customer care
|
≥ 95%
|
- A total of 915 private satellite TV channels has been permitted by the Ministry of Information and Broadcasting (MIB) for uplinking only/downlinking only/both uplinking & downlinking.
- As per the reporting done by broadcasters, out of 906 permitted satellite TV channels that are available for downlinking in India, there are 342 TV channels are declared as pay TV channels as on 30th, June. Out of 342 pay channels, 238 are SD TV channels and 104 are HD TV channels. Apart from these pay channels reported to TRAI, remaining 566 channels, permitted by MIB, are considered as Free-to-Air (FTA) channels.
- There are 4 pay DTH operators providing DTH broadcasting services in India. As per the data reported by these pay DTH operators to TRAI, pay DTH services have a total active subscriber base of 48.56 million as on 30th June 2026. This is in addition to the subscribers of the DD Free Dish (free DTH services of Prasar Bharati). The total active subscriber base of pay DTH services has declined from 49.09 million in the quarter ending March 2026 to 48.56 million in the quarter ending June 2026.
- As per the data reported by FM Radio operators to TRAI, as on 31st March 2026, there were 390 operational private FM radio channels across 120 cities, operated by 31 private FM radio operators. During the quarter ending 30th June 2026, the permissions of five channels have been surrendered w.e.f. 14.06.2026. Further, M/s HT Media Ltd has started operation of one new channel in a new city (Moradabad) w.e.f. 19.04.2026. Therefore, as on 30th June 2026, there are 386 operational private FM radio channels across 121 cities, operated by 30 private FM radio operators.
- The advertisement revenue reported by FM Radio operators during the quarter ending 30th June 2026 in respect of 391 private FM Radio channels is Rs 376.16 crore as against Rs 414.03 crore in respect of 390 private FM Radio channels for the previous quarter i.e. 31st March 2026.
- As on 30th June, 2026, 578 Community Radio stations are operational.
SNAPSHOT
|
(Data as on Quarter ending 30th June 2026)
|
|
Telecom Subscribers (Wireless+Wireline)
|
|
Total Subscribers
|
1,348.08 million
|
|
% change over the previous quarter
|
1.31%
|
|
Urban Subscribers
|
792.06 million
|
|
Rural Subscribers
|
556.01 million
|
|
Market share of Private Operators
|
92.50%
|
|
Market share of PSU Operators
|
7.50%
|
|
Tele-density
|
94.31%
|
|
Urban Tele-density
|
153.43%
|
|
Rural Tele-density
|
60.89%
|
|
Tele-density (without M2M cellular mobile)
|
84.88%
|
|
Wireless Subscribers
|
|
Wireless (Mobile) Subscribers
|
1,282.38 million
|
|
Wireless (Mobile) Subscribers (excluding M2M)
|
1147.65 million
|
|
Wireless (FWA) Subscribers
|
17.87 million
|
|
Total Wireless (Mobile + FWA) Subscribers
|
1,300.25 million
|
|
% change over the previous quarter
|
1.40%
|
|
Urban Subscribers
|
749.39 million
|
|
Rural Subscribers
|
550.86 million
|
|
Market share of Private Operators
|
92.83%
|
|
Market share of PSU Operators
|
7.17%
|
|
Tele-density
|
90.96%
|
|
Urban Tele-density
|
145.17%
|
|
Rural Tele-density
|
60.32%
|
|
Tele-density without M2M cellular mobile connection
|
81.54%
|
|
Total Wireless (Mobile) Data Usage during the quarter
|
84,424 PB
|
|
Total Wireline (Wired) Access Data Usage during the quarter
|
54,303 PB
|
|
Number of Public Mobile Radio Trunk Services (PMRTS)
|
65,686
|
|
Number of Very Small Aperture Terminals (VSAT)
|
1,84,579
|
|
Wireline Subscribers
|
|
Total Wireline Subscribers
|
47.82 million
|
|
% change over the previous quarter
|
-0.88%
|
|
Urban Subscribers
|
42.68 million
|
|
Rural Subscribers
|
5.15 million
|
|
Market share of PSU Operators
|
16.59%
|
|
Market share of Private Operators
|
83.41%
|
|
Tele-density
|
3.35%
|
|
Rural Tele-density
|
0.56%
|
|
Urban Tele-density
|
8.27%
|
|
No. of Public Call Office (PCO)
|
4,843
|
|
Telecom Financial Data
|
|
Gross Revenue (GR) during the quarter
|
₹1,06,797 crore
|
|
% change in GR over the previous quarter
|
1.60%
|
|
Applicable Gross Revenue (ApGR) during quarter
|
₹1,01,036 crore
|
|
% change in ApGR over the previous quarter
|
2.43%
|
|
Adjusted Gross Revenue (AGR) during the quarter
|
₹88,796 crore
|
|
% change in AGR over the previous quarter
|
2.40%
|
|
Share of Public sector undertakings in Access AGR
|
2.92%
|
|
Internet/Broadband Subscribers
|
|
Total Internet Subscribers
|
1,114.17 million
|
|
% change over previous quarter
|
1.96%
|
|
Narrowband subscribers
|
26.67 million
|
|
Broadband subscribers
|
1087.50 million
|
|
Fixed (Wired) Access Internet Subscribers
|
47.73 million
|
|
Wireless (Fixed+Mobile) Access Internet Subscribers
|
1066.43 million
|
|
Urban Internet Subscribers
|
666.09 million
|
|
Rural Internet Subscribers
|
448.08 million
|
|
Total Internet Subscribers per 100 population
|
77.94
|
|
Urban Internet Subscribers per 100 population
|
129.03
|
|
Rural Internet Subscribers per 100 population
|
49.07
|
|
Total Outgoing Minutes of Usage for Internet Telephony
|
73.97 million
|
|
No. of Public Wi-Fi Hotspots
|
55,233
|
|
Aggregate Data Consumed (TB) for Wi-Fi Hotspots
|
7,541
|
|
Broadcasting & Cable Services
|
|
Number of pay Broadcaster
|
37
|
|
Number of private satellite TV channels permitted by the Ministry of I&B for uplinking only/downlinking only/both uplinking and downlinking
|
915
|
|
Number of pay TV Channels as reported by broadcasters
|
342
|
|
Number of licensed pay DTH Operators
|
4
|
|
Number of total active subscribers with pay DTH operators
|
48.56 million
|
|
Number of registered MSOs
|
736
|
|
Number of HITS operators
|
2
|
|
Number of IPTV Operators that submitted self-declaration to MIB
|
76
|
|
Number of FM Radio Channels (excluding All India Radio)
|
386
|
|
Number of existing cities with operational FM Radio channels (excluding All India Radio)
|
121
|
|
FM Radio Advertisement Revenue during the quarter
|
₹376.16 crore
|
|
Number of Operational Community Radio Stations
|
578
|
|
Revenue & Usage Parameters
|
|
Monthly ARPU of Wireless Service
|
₹187.12
|
|
Minutes of Usage (MOU) per subscriber per month - Wireless Service
|
933
|
|
Wireless Data Usage
|
|
Average Wireless Data Usage per wireless data subscriber per month
|
28.39 GB
|
|
Average revenue realization per GB for wireless data usage during the quarter
|
₹7.13
|
*****
AMK/AR
(रिलीज़ आईडी: 2322388)
|