Ministry of Statistics & Programme Implementation
PRESS RELEASE OF CONSUMER PRICE INDEX ON BASE 2024=100 FOR MAY, 2026
Posted On:
12 JUN 2026 4:00PM by PIB Delhi
Highlights
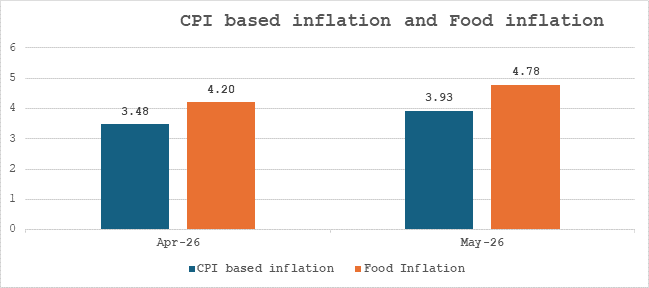
Retail inflation based on Consumer Price Index in May, 2026 is 3.93%
Year on year food inflation, based on Consumer Food Price Index, in May, 2026 is 4.78%
|
I. Key Statistics
-
National Level Indices
-
-
Year-on-year inflation rate based on All India Consumer Price Index (CPI) with base year 2024 for the month of May, 2026 over May, 2025 is 3.93%(Provisional). Corresponding inflation rates for rural and urban are 4.25% and 3.53%, respectively.
|
|
May, 2026 (Provisional)
|
April, 2026 (Final)
|
|
Rural
|
Urban
|
Combined
|
Rural
|
Urban
|
Combined
|
|
Inflation (%)
|
CPI (General)
|
4.25
|
3.53
|
3.93
|
3.74
|
3.16
|
3.48
|
|
CFPI
|
4.85
|
4.66
|
4.78
|
4.26
|
4.10
|
4.20
|
|
Index
|
CPI (General)
|
106.11
|
105.66
|
105.91
|
105.28
|
104.92
|
105.12
|
|
CFPI
|
105.07
|
105.83
|
105.35
|
104.17
|
104.77
|
104.39
|
-
-
Food Inflation: - Year-on-year inflation rate based on All India Consumer Food Price Index (CFPI) for the month of May, 2026 over May, 2025 is 4.78% (Provisional). Corresponding inflation rates for rural and urban are 4.85% and 4.66%, respectively.
|
S.No.
|
Item
|
Weight
|
Inflation (%)
April, 2026
|
Inflation (%)
May, 2026
|
|
1
|
Potato
|

|
0.7549
|
-23.66
|
-23.71
|
|
2
|
Peas
|

|
0.1254
|
-6.54
|
-11.47
|
|
3
|
Motor car
and jeep
|

|
0.4665
|
-7.12
|
-7.19
|
|
4
|
Cumin (jeera)
|

|
0.3656
|
-5.03
|
-4.59
|
|
5
|
Motor cycle and scooter
|

|
0.6581
|
-3.61
|
-3.56
|
|
S.No.
|
Item
|
Weight
|
Inflation (%)
April, 2026
|
Inflation (%)
May, 2026
|
|
1
|
Silver Jewellery
|

|
0.3127
|
144.36
|
155.23
|
|
2
|
Tomato
|

|
0.4961
|
35.26
|
48.43
|
|
3
|
Gold/Diamond/Platinum Jewellery
|

|
0.6230
|
40.74
|
40.93
|
|
4
|
Ginger
|

|
0.2556
|
14.36
|
32.49
|
|
5
|
Raisin (kishmish) and monacca
|
|
0.1639
|
23.96
|
21.97
|
-
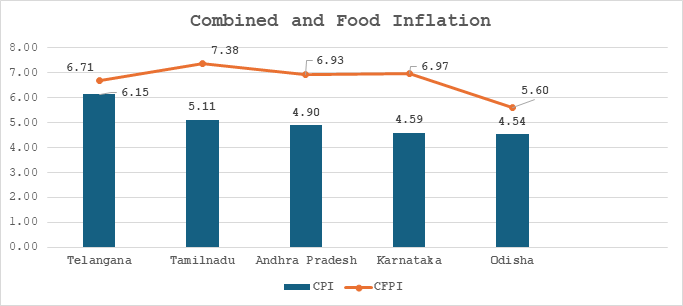
State level Indices
Top five States (having more than 50 lakhs population as per Census 2011) with highest inflation in May, 2026 are given below-
-
April 2026 (Final) figures for CPI base 2024=100
All India CPI, CFPI and corresponding inflation rates for the month of April 2026 (Final) with base year 2024 are given as follows-
|
|
April, 2026 (Final) at Base 2024=100
|
|
Rural
|
Urban
|
Combined
|
|
Inflation (%)
|
CPI (General)
|
3.74
|
3.16
|
3.48
|
|
CFPI
|
4.26
|
4.10
|
4.20
|
|
Index
|
CPI (General)
|
105.28
|
104.92
|
105.12
|
|
CFPI
|
104.17
|
104.77
|
104.39
|
-
Response Rate- Real time price data are collected from selected 1407 urban Markets (including
online markets) and 1465 villages covering all States/UTs through personal visits by field staff of
Field Operations Division of NSO, MoSPI on a weekly roster. During May 2026, the response rate was 100% in both rural and urban markets.
CPI for June 2026 will be released on 13th July, 2026 (Monday) or the next working day in case of 13th being a holiday.
State and Item wise indices for May 2026 may be downloaded from eSankhyiki portal of MoSPI- https://esankhyiki.mospi.gov.in/
State-level item indices, available on the portal, should be interpreted cautiously in view of thin samples of price used for index compilation in some of the cases.
Indices at all levels and inflation rates are compiled using the actual index values without rounding off. However, the indices published are rounded off to two decimal places. Therefore, higher-level indices, if calculated from the published figures may observe minute differences.
The reference period for price reporting for petrol, diesel and LPG prices are 15th of the corresponding month.
|
IV. Annexures
|
Annexure
|
Title
|
|
I
|
All India General (Rural, Urban and Combined) division wise indices and inflation for May, 2026 (Provisional)
|
|
II
|
All India General (Rural, Urban and Combined) group wise indices and inflation for May, 2026 (Provisional)
|
|
III
|
State/UT wise general index and inflation in May, 2026 (Provisional)
|
|
IV
|
All India Combined (General) level index and inflation
|
Annexure- I
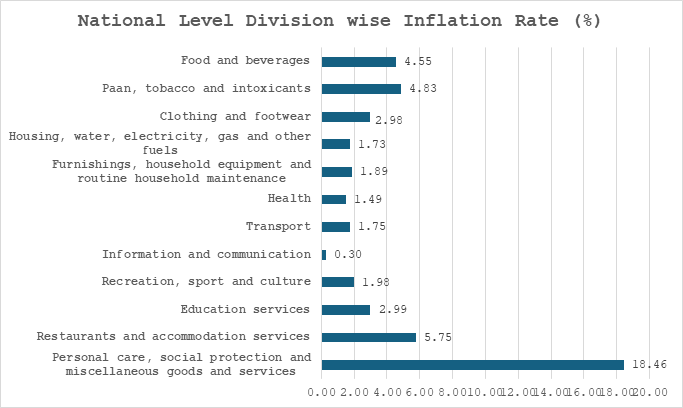
All India General (Rural, Urban and Combined) division wise indices and inflation for May, 2026 (Provisional)
|
Division code
|
Division name
|
Index
|
Inflation
|
|
Rural
|
Urban
|
Comb.
|
Rural
|
Urban
|
Comb.
|
|
(i)
|
(ii)
|
(iii)
|
(iv)
|
(v)
|
(vi)
|
(vii)
|
(viii)
|
|
01
|
Food and beverages
|
105.02
|
105.69
|
105.26
|
4.64
|
4.38
|
4.55
|
|
02
|
Paan, tobacco and intoxicants
|
107.64
|
107.97
|
107.74
|
4.61
|
5.35
|
4.83
|
|
03
|
Clothing and footwear
|
108.31
|
105.96
|
107.41
|
3.49
|
2.16
|
2.98
|
|
04
|
Housing, water, electricity, gas and other fuels
|
103.59
|
102.81
|
103.1
|
1.96
|
1.59
|
1.73
|
|
05
|
Furnishings, household equipment and routine household maintenance
|
104.64
|
103.82
|
104.29
|
2.24
|
1.43
|
1.89
|
|
06
|
Health
|
104.04
|
104.7
|
104.3
|
1.44
|
1.57
|
1.49
|
|
07
|
Transport
|
102.8
|
102.64
|
102.73
|
1.81
|
1.68
|
1.75
|
|
08
|
Information and communication
|
104.12
|
103.49
|
103.84
|
0.36
|
0.21
|
0.3
|
|
09
|
Recreation, sport and culture
|
104.56
|
103.85
|
104.2
|
2.24
|
1.72
|
1.98
|
|
10
|
Education services
|
105.55
|
106.64
|
106.21
|
2.77
|
3.14
|
2.99
|
|
11
|
Restaurants and accommodation services
|
109.18
|
110.57
|
109.91
|
5.47
|
5.99
|
5.75
|
|
13
|
Personal care, social protection and miscellaneous goods and services
|
126.53
|
124.22
|
125.53
|
19.52
|
17.07
|
18.46
|
|
|
All India
|
106.11
|
105.66
|
105.91
|
4.25
|
3.53
|
3.93
|
Note: Comb.: Combined
Annexure- II
All India General (Rural, Urban and Combined) group wise indices and inflation for May, 2026 (provisional)
|
S.No.
|
Group code
|
Group name
|
Index
|
Inflation
|
|
Rural
|
Urban
|
Comb.
|
Rural
|
Urban
|
Comb.
|
|
(i)
|
(ii)
|
(iii)
|
(iv)
|
(v)
|
(vi)
|
(vii)
|
(viii)
|
(ix)
|
-
|
01.1
|
Food
|
105.07
|
105.83
|
105.35
|
4.85
|
4.66
|
4.78
|
-
|
01.2
|
Beverages
|
103.56
|
103.15
|
103.38
|
0.36
|
0.05
|
0.23
|
-
|
01.3
|
Services for processing primary goods for food
|
107.45
|
107.63
|
107.50
|
3.17
|
3.34
|
3.22
|
-
|
02.1
|
Alcoholic beverages
|
107.11
|
106.01
|
106.75
|
3.11
|
2.64
|
2.96
|
-
|
02.3
|
Paan and tobacco
|
108.11
|
110.02
|
108.67
|
5.96
|
8.22
|
6.62
|
-
|
03.1
|
Clothing
|
108.82
|
106.62
|
107.98
|
3.87
|
2.68
|
3.42
|
-
|
03.2
|
Footwear
|
104.94
|
101.84
|
103.72
|
0.95
|
-1.18
|
0.12
|
-
|
04.1
|
Actual rental payments made for housing
|
103.58
|
103.07
|
103.19
|
2.56
|
1.89
|
2.04
|
-
|
04.3
|
Maintenance, repair and security of the dwelling
|
106.50
|
105.58
|
106.16
|
3.43
|
2.37
|
3.04
|
-
|
04.4
|
Water supply and miscellaneous services relating to the dwelling
|
101.60
|
102.46
|
102.20
|
1.00
|
1.42
|
1.29
|
-
|
04.5
|
Electricity, gas and other fuels
|
102.97
|
101.24
|
102.29
|
1.19
|
0.23
|
0.81
|
-
|
05.1
|
Furniture, furnishings, and loose carpets
|
106.62
|
105.40
|
106.15
|
3.16
|
2.43
|
2.89
|
-
|
05.2
|
Household textiles
|
106.95
|
104.73
|
106.12
|
3.26
|
1.19
|
2.48
|
-
|
05.3
|
Household appliances
|
104.18
|
102.17
|
103.25
|
1.83
|
0.09
|
1.02
|
-
|
05.4
|
Glassware, tableware and household utensils
|
108.86
|
106.46
|
107.94
|
4.91
|
2.90
|
4.15
|
-
|
05.5
|
Tools and equipment for house and garden
|
98.69
|
99.05
|
98.81
|
-1.39
|
-0.13
|
-0.98
|
-
|
05.6
|
Goods and services for routine household maintenance
|
103.47
|
103.83
|
103.63
|
1.65
|
1.56
|
1.61
|
-
|
06.1
|
Medicines and health products
|
104.91
|
104.79
|
104.87
|
1.77
|
1.15
|
1.54
|
-
|
06.2
|
Outpatient care services
|
102.10
|
104.59
|
103.11
|
0.73
|
2.39
|
1.41
|
-
|
06.3
|
Inpatient care services
|
102.98
|
105.65
|
104.09
|
0.85
|
2.95
|
1.73
|
-
|
06.4
|
Other health services
|
102.65
|
103.46
|
102.95
|
0.98
|
1.45
|
1.16
|
-
|
07.1
|
Purchase of vehicles
|
98.29
|
97.32
|
97.80
|
-4.60
|
-4.97
|
-4.79
|
-
|
07.2
|
Operation of personal transport equipment
|
103.04
|
103.04
|
103.04
|
3.07
|
3.05
|
3.06
|
-
|
07.3
|
Passenger transport services
|
104.12
|
104.70
|
104.36
|
2.07
|
2.51
|
2.25
|
-
|
07.4
|
Transport services for goods
|
107.73
|
107.89
|
107.83
|
7.48
|
7.74
|
7.63
|
-
|
08.1
|
Information and communication equipment
|
99.94
|
99.03
|
99.52
|
0.53
|
-0.12
|
0.23
|
-
|
08.3
|
Information and communication services
|
105.24
|
104.81
|
105.05
|
0.32
|
0.31
|
0.32
|
-
|
09.1
|
Recreational durables
|
99.02
|
100.67
|
100.17
|
-0.49
|
-0.15
|
-0.25
|
-
|
09.2
|
Other recreational goods
|
106.17
|
106.10
|
106.14
|
3.02
|
2.69
|
2.88
|
-
|
09.3
|
Garden products and pets
|
110.73
|
109.42
|
110.03
|
5.18
|
4.19
|
4.65
|
-
|
09.4
|
Recreational services
|
106.30
|
102.11
|
103.78
|
4.55
|
0.91
|
2.37
|
|
(i)
|
(ii)
|
(iii)
|
(iv)
|
(v)
|
(vi)
|
(vii)
|
(viii)
|
(ix)
|
-
|
09.5
|
Cultural goods
|
102.78
|
105.12
|
103.94
|
1.52
|
2.04
|
1.78
|
-
|
09.6
|
Cultural services
|
104.30
|
104.81
|
104.61
|
2.21
|
2.03
|
2.10
|
-
|
09.7
|
Newspapers, books and stationery
|
102.78
|
102.75
|
102.77
|
0.95
|
1.26
|
1.09
|
-
|
10.1
|
Early childhood and primary education
|
107.26
|
107.21
|
107.23
|
3.69
|
2.80
|
3.13
|
-
|
10.2
|
Secondary education
|
106.46
|
107.94
|
107.40
|
3.28
|
3.83
|
3.63
|
-
|
10.4
|
Higher education
|
102.57
|
106.05
|
104.82
|
1.56
|
4.77
|
3.64
|
-
|
10.5
|
Education not defined by level
|
103.43
|
103.84
|
103.63
|
1.36
|
1.65
|
1.50
|
-
|
11.1
|
Food and beverage serving services
|
109.22
|
110.59
|
109.95
|
5.50
|
6.01
|
5.77
|
-
|
11.2
|
Accommodation services
|
102.80
|
105.39
|
103.96
|
1.02
|
2.65
|
1.76
|
-
|
13.1
|
Personal care
|
105.23
|
105.76
|
105.46
|
2.39
|
2.50
|
2.44
|
-
|
13.2
|
Other personal effects
|
183.79
|
171.46
|
178.33
|
60.78
|
50.74
|
56.35
|
-
|
13.9
|
Other services
|
103.20
|
102.34
|
102.86
|
1.63
|
1.08
|
1.41
|
Note: Comb.: Combined
Annexure-III
State/UT wise general index and inflation in May, 2026 (Provisional)
|
S.No.
|
State/UT
|
CPI
|
Inflation
|
|
|
|
Rural
|
Urban
|
Combined
|
Rural
|
Urban
|
Combined
|
|
|
(i)
|
(ii)
|
(iii)
|
(iv)
|
(v)
|
(vi)
|
(vii)
|
(viii)
|
|
-
|
Andaman And Nicobar Islands
|
109.05
|
105.64
|
107.38
|
5.67
|
3.06
|
4.40
|
|
-
|
Andhra Pradesh
|
106.04
|
106.10
|
106.06
|
5.09
|
4.61
|
4.90
|
|
-
|
Arunachal Pradesh
|
104.36
|
104.36
|
104.36
|
2.56
|
2.64
|
2.58
|
|
-
|
Assam
|
105.05
|
103.69
|
104.76
|
3.79
|
2.09
|
3.44
|
|
-
|
Bihar
|
104.57
|
103.79
|
104.46
|
3.07
|
2.14
|
2.94
|
|
-
|
Chandigarh
|
*
|
105.93
|
105.93
|
*
|
3.80
|
3.80
|
|
-
|
Chhattisgarh
|
102.94
|
102.85
|
102.90
|
3.25
|
2.14
|
2.87
|
|
-
|
Goa
|
104.63
|
104.99
|
104.86
|
2.00
|
2.72
|
2.47
|
|
-
|
Gujarat
|
105.02
|
104.66
|
104.80
|
3.73
|
2.95
|
3.27
|
|
-
|
Haryana
|
105.85
|
105.45
|
105.65
|
3.42
|
2.77
|
3.09
|
|
-
|
Himachal Pradesh
|
105.33
|
106.93
|
105.58
|
2.87
|
4.03
|
3.05
|
|
-
|
Jammu And Kashmir
|
105.91
|
105.23
|
105.72
|
2.80
|
2.95
|
2.84
|
|
-
|
Jharkhand
|
104.90
|
103.46
|
104.41
|
4.25
|
3.10
|
3.86
|
|
-
|
Karnataka
|
107.59
|
106.69
|
107.14
|
4.83
|
4.35
|
4.59
|
|
-
|
Kerala
|
108.03
|
106.65
|
107.27
|
4.72
|
3.96
|
4.30
|
|
-
|
Ladakh
|
106.60
|
105.92
|
106.43
|
3.21
|
2.90
|
3.14
|
|
-
|
Lakshadweep
|
105.33
|
106.67
|
106.30
|
2.99
|
3.79
|
3.57
|
|
-
|
Madhya Pradesh
|
106.40
|
105.76
|
106.15
|
4.33
|
3.93
|
4.17
|
|
-
|
Maharashtra
|
106.45
|
105.19
|
105.68
|
4.20
|
2.80
|
3.35
|
|
-
|
Manipur
|
103.27
|
104.04
|
103.52
|
3.06
|
2.22
|
2.79
|
|
-
|
Meghalaya
|
105.45
|
104.45
|
105.19
|
2.78
|
2.45
|
2.70
|
|
-
|
Mizoram
|
103.99
|
102.64
|
103.22
|
1.42
|
0.74
|
1.03
|
|
-
|
Nagaland
|
106.26
|
104.06
|
105.42
|
3.70
|
2.64
|
3.30
|
|
-
|
NCT of Delhi
|
103.31
|
103.90
|
103.89
|
3.53
|
2.47
|
2.50
|
|
-
|
Odisha
|
105.28
|
104.80
|
105.15
|
4.83
|
3.74
|
4.54
|
|
-
|
Puducherry
|
107.24
|
107.19
|
107.21
|
5.16
|
4.93
|
5.00
|
|
-
|
Punjab
|
106.68
|
105.63
|
106.20
|
3.64
|
2.99
|
3.34
|
|
-
|
Rajasthan
|
106.53
|
105.95
|
106.32
|
4.52
|
3.54
|
4.17
|
|
-
|
Sikkim
|
107.10
|
106.60
|
106.93
|
4.34
|
4.01
|
4.23
|
|
-
|
Tamil Nadu
|
107.38
|
106.96
|
107.14
|
5.58
|
4.75
|
5.11
|
|
-
|
Telangana
|
109.10
|
108.51
|
108.76
|
6.59
|
5.81
|
6.15
|
|
-
|
The Dadra And Nagar Haveli And Daman And Diu
|
104.99
|
105.73
|
105.55
|
3.36
|
4.20
|
3.99
|
|
-
|
Tripura
|
102.83
|
103.40
|
102.96
|
1.78
|
2.80
|
2.02
|
|
-
|
Uttar Pradesh
|
106.24
|
105.58
|
106.03
|
4.30
|
3.27
|
3.97
|
|
-
|
Uttarakhand
|
107.13
|
105.04
|
106.37
|
4.29
|
2.72
|
3.72
|
|
-
|
West Bengal
|
105.19
|
104.80
|
105.02
|
3.94
|
2.80
|
3.44
|
|
*: No rural market in Chandigarh
Annexure-IV
All India Combined (General) level index and inflation
|
Month
|
Index
|
Inflation (%)
|
|
Rural
|
Urban
|
Combined
|
Rural
|
Urban
|
Combined
|
|
(i)
|
(ii)
|
(iii)
|
(iv)
|
(v)
|
(vi)
|
(vii)
|
|
Jan-25
|
101.81
|
101.49
|
101.67
|
|
|
|
|
Feb-25
|
101.33
|
101.30
|
101.32
|
|
|
|
|
Mar-25
|
101.34
|
101.47
|
101.39
|
|
|
|
|
Apr-25
|
101.49
|
101.71
|
101.58
|
|
|
|
|
May-25
|
101.78
|
102.06
|
101.90
|
|
|
|
|
Jun-25
|
102.39
|
102.66
|
102.51
|
|
|
|
|
Jul-25
|
103.34
|
103.36
|
103.35
|
|
|
|
|
Aug-25
|
103.84
|
103.60
|
103.74
|
|
|
|
|
Sep-25
|
103.80
|
103.66
|
103.74
|
|
|
|
|
Oct-25
|
103.85
|
103.61
|
103.74
|
|
|
|
|
Nov-25
|
104.16
|
103.83
|
104.01
|
|
|
|
|
Dec-25
|
104.19
|
103.98
|
104.10
|
|
|
|
|
Jan-26
|
104.59
|
104.28
|
104.45
|
2.73
|
2.75
|
2.74
|
|
Feb-26
|
104.74
|
104.36
|
104.57
|
3.37
|
3.02
|
3.21
|
|
Mar-26
|
105.02
|
104.62
|
104.84
|
3.63
|
3.11
|
3.40
|
|
Apr-26
|
105.28
|
104.92
|
105.12
|
3.74
|
3.16
|
3.48
|
|
May-26*
|
106.11
|
105.66
|
105.91
|
4.25
|
3.53
|
3.93
|
*Index and Inflation for the month of May 2026 are provisional.
Click here to see pdf
***
Samrat
(Release ID: 2272112)
Visitor Counter : 2693