Ministry of Petroleum & Natural Gas
Monthly Production Report for April 2020
Posted On:
23 MAY 2020 11:29AM by PIB Delhi
- Production of Crude Oil
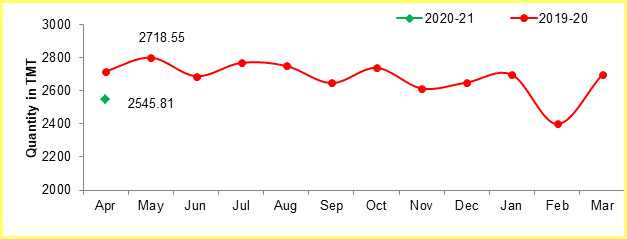
Crude oil production[1] during April 2020 was 2545.81 TMT which is 1.44% lower than monthly target and 6.35% lower than the production achieved in April 2019. Unit-wise and state-wise crude oil production is given at Annexure-I. Unit-wise crude oil production for the month of April, 2020 vis-à-vis April, 2019 has been shown in Table-1 and month-wise in Figure-1.
Table-1: Crude Oil Production (in TMT)
|
Oil Company
|
Target
|
April (Month)
|
|
2020-21 (Apr-Mar)
|
2020-21
|
2019-20
|
% over last year
|
|
Target
|
Prod.*
|
Prod.
|
|
ONGC
|
20931.54
|
1692.83
|
1681.77
|
1690.78
|
99.47
|
|
OIL
|
3268.00
|
250.52
|
248.25
|
265.21
|
93.61
|
|
PSC Fields
|
8265.00
|
639.68
|
615.80
|
762.55
|
80.75
|
|
Total
|
32464.53
|
2583.03
|
2545.81
|
2718.55
|
93.65
|
Note: 1. Target for the year 2020-21 is provisional, subject to finalization. *: Provisional
2. Totals may not tally due to rounding off.
Figure-1: Monthly Crude Oil Production
Unit-wise production details with reasons for shortfall have been given below:
1.1 Crude oil production by ONGC in nomination block during April, 2020 was 1681.77 TMT which is 0.65% lower than the monthly target and 0.53% lower when compared with actual production in April, 2019. Reasons for shortfall in production are as under:
-
- Closure of wells in Western Offshore due to less offtake by M/s GAIL due to Covid-19 Lockdown.
- Restriction of movements for field operations in Onshore fields due to Covid-19 lockdown.
1.2 Crude oil production by OIL in the nomination block during April, 2020 was 248.25 TMT which is 0.9% lower than monthly target and 6.39% lower when compared with actual production in April, 2019. Reasons for shortfall in production are as under:
-
- Less than planned contribution from workover wells and drilling wells.
- Rise in water cut and decline in liquid production from existing wells.
- Loss of production due to nationwide lockdown for COVID-19 Pandemic.
1.3 Crude oil production by Pvt/JVs in the PSC regime during April, 2020 was 615.80 TMT which is 3.73% lower than the monthly target and 19.25% lower when compared with actual production in April, 2019. Reasons for shortfall in production are as under:
-
- RJ-ON-90/1- Mangala: Delay in hook-up of new wells, ESP failure, delay in workover wells revival and new injector due to COVID 19 impact. (CEIL)
- RJ-ON-90/1- Bhagyam: Artificial lifts (PCP) malfunction & delayed start-up of full field polymer injection. (CEIL)
- RJ-ON-90/1- Aishwarya: Delay in Lower Fatehgarh polymer FDP completion. ESP, Jet Pump failure in few wells. (CEIL)
- RJ-ON-90/1- ABH: Delay in setting up permanent processing facility and COVID 19 also caused delay in hook-up of Pad-8 and Pad-3 planned in March end. (CEIL)
- RJ-ON-90/1- Satellite Fields: Failure or flow cease in few wells. (CEIL)
- AAP-ON-94/1: Low consumer demand- Covid -19 lockdown. (HOEC)
- CB-ONN-2003/1: Less offtake due to COVID-19 lockdown. (SUN)
2. Production of Natural Gas
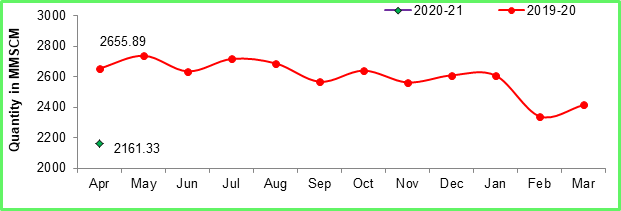
Natural gas production during April, 2020 was 2161.33 MMSCM which is 10.88% lower than the target for the month and 18.62% lower when compared with actual production in April, 2019. Unit-wise and state-wise natural gas production is given at Annexure-II. Unit-wise natural gas production for the month of April, 2020 vis-à-vis April, 2019 has been shown in Table-2 and month-wise in Figure-2.
Table-2: Natural Gas Production (MMSCM)
|
Oil Company
|
Target
|
April (Month)
|
|
2020-21 (Apr-Mar)
|
2020-21
|
2019-20
|
% over last year
|
|
Target
|
Prod.*
|
Prod.
|
|
ONGC
|
24437.08
|
1977.42
|
1725.69
|
2037.71
|
84.69
|
|
OIL
|
3181.54
|
211.88
|
202.05
|
224.49
|
90.01
|
|
PSC Fields
|
6826.82
|
236.02
|
233.59
|
393.70
|
59.33
|
|
Total
|
34445.44
|
2425.32
|
2161.33
|
2655.89
|
81.38
|
Note: 1. Target for the year 2020-21 is provisional, subject to finalization. *: Provisional
2. Totals may not tally due to rounding off.
Figure-2: Monthly Natural Gas Production
2.1 Natural gas production by ONGC in the nomination block during April, 2020 was 1725.69 MMSCM which is 12.73% lower than the monthly target and 15.31% lower when compared with actual production in April, 2019. The shortfall in gas production is primarily due to less gas off take by consumers due to Covid-19 lockdown.
2.2 Natural gas production by OIL in the nomination block during April, 2020 was 202.05 MMSCM which is 4.64% lower than the monthly target and 9.99 lower when compared with actual production in April, 2019. Reasons for shortfall in production are as under:
- Loss of potential in Deohal area due to presence of CO2 in production stream.
- Less gas off take by consumers due to Covid-19 lockdown.
2.3 Natural gas production by Pvt/JVs in PSC regime during April, 2020 was 233.59 MMSCM which is 1.03% lower than the monthly target and 40.67% lower when compared with actual production in April, 2019. The shortfall in gas production is primarily due to less gas off take by consumers due to Covid-19 lockdown.
- Refinery Production (in terms of crude oil processed)
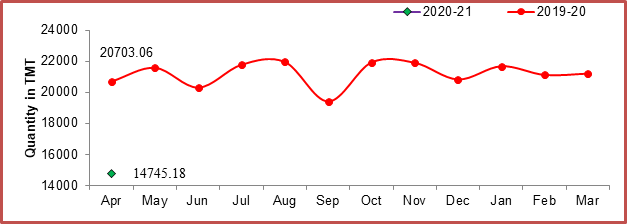
Refinery production during April, 2020 was 14745.18 TMT which is 22.01% lower than the target for the month and 28.78% lower when compared with actual production in April, 2019. Unit-wise production is given at Annexure-III. Company-wise production for the month of April, 2020 vis-à-vis same period of last year has been shown in Table-3 and month-wise in Figure-3.
Table 3: Refinery Production (TMT)
|
Oil Company
|
Target
|
April (Month)
|
|
2020-21 (Apr-Mar)
|
2020-21
|
2019-20
|
% over last year
|
|
Target
|
Prod.*
|
Prod.
|
|
CPSE
|
148031.12
|
9992.36
|
7103.76
|
11263.33
|
63.07
|
|
IOCL
|
72499.86
|
4674.14
|
3046.13
|
5534.44
|
55.04
|
|
BPCL
|
30499.95
|
2584.42
|
1583.76
|
2573.24
|
61.55
|
|
HPCL
|
17867.47
|
1506.38
|
1323.97
|
1089.86
|
121.48
|
|
CPCL
|
9000.00
|
300.00
|
307.60
|
839.91
|
36.62
|
|
NRL
|
2700.00
|
222.00
|
169.73
|
240.70
|
70.52
|
|
MRPL
|
15400.00
|
700.00
|
670.65
|
978.99
|
68.50
|
|
ONGC
|
63.83
|
5.42
|
1.92
|
6.19
|
30.98
|
|
JVs
|
14772.00
|
1197.00
|
925.13
|
1721.66
|
53.74
|
|
BORL
|
7800.00
|
640.00
|
332.28
|
671.06
|
49.52
|
|
HMEL
|
6972.00
|
557.00
|
592.85
|
1050.60
|
56.43
|
|
Private
|
89515.16
|
7718.08
|
6716.28
|
7718.08
|
87.02
|
|
RIL
|
68894.99
|
6006.00
|
5314.49
|
6006.00
|
88.49
|
|
NEL
|
20620.18
|
1712.08
|
1401.79
|
1712.08
|
81.88
|
|
TOTAL
|
252318.28
|
18907.44
|
14745.18
|
20703.06
|
71.22
|
Note: 1. Target for the year 2020-21 is provisional, subject to finalization. *: Provisional
2. Totals may not tally due to rounding off.
Figure 3: Monthly Refinery Production
3.1 CPSE Refineries’ production during April, 2020 was 7103.76 TMT which is 28.91% lower than the target for the month and 36.93% lower than the production achieved in the corresponding month of last year. Reasons for shortfall of refinery production in some CPSE refineries are as under:
-
-
- IOCL, Guwahati: BS VI shutdown deferment.
- IOCL-Barauni, Gujarat, Haldia, Matura, Panipat and Paradip: Lower due to low demand due to COVID-19 lockdown.
- IOCL-Bongaigaon: Deferment of plan shutdown.
- BPCL, Mumbai & Kochi: Lower due to low demand and COVID-19 lockdown.
- HPCL, Mumbai & Visakh: Lower due to impact of COVID-19 lockdown.
- CPCL, Manali: Lower due to low demand due to COVID-19 lockdown.
3.2 Production in JV refineries during April, 2020 were 925.13 TMT which is 22.71% lower than the target for the month and 46.26% lower than the production achieved in the corresponding month of last year. Reasons for shortfall in production mainly include low demand due to COVID-19 lockdown.
3.3 Production in private refineries during April, 2020 was 6716.28 TMT which is lower than the target for the month and when compared with April, 2019 by 12.98% and 12.98 % respectively.
3.4 Refinery-wise details of the capacity utilization and production of petroleum products during the month of April, 2020 vis-à-vis April, 2019 are given at Annexures-IV and V respectively.
Click here to see Annexure-I
Click here to see Annexure-II
Click here to see Annexure-III
Click here to see Annexure-IV
Click here to see Annexure- V
******************
YB
(Release ID: 1626327)
Visitor Counter : 2142