Crude Oil
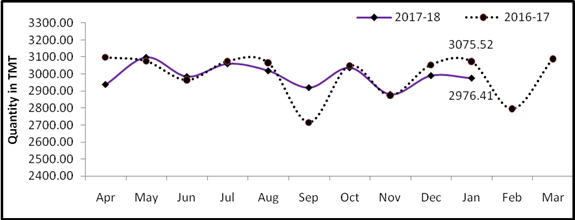
- Crude oil production[1] during January, 2018 was 2976.41 TMT which is 5.88% lower than target and 3.22% lower when compared with January 2017. Cumulative crude oil production during April-January, 2017-18 was 29910.80 TMT which is 4.48% lower than target for the period and 0.7% lower than production during corresponding period of last year. Unit-wise and State-wise crude oil production is given at Annexure-I. Unit-wise crude oil production for the month of January, 2018 and cumulatively for the period April-January, 2017-18 vis-à-vis same period of last year has been shown in Table-1 and month-wise in Figure-1.
Table-1: Crude Oil Production (in TMT)
|
Oil Company
|
Target
|
January (Month)
|
April-January (Cumulative)
|
|
2017-18 (Apr-Mar)
|
2017-18
|
2016-17
|
% over last year
|
2017-18
|
2016-17
|
% over last year
|
|
Target
|
Prod.*
|
Prod.
|
Target
|
Prod.*
|
Prod.
|
|
ONGC
|
23071.00
|
1942.59
|
1836.79
|
1916.36
|
95.85
|
19272.91
|
18685.49
|
18545.46
|
100.76
|
|
OIL
|
3734.00
|
317.03
|
285.40
|
274.06
|
104.14
|
3130.03
|
2833.82
|
2704.51
|
104.78
|
|
PSC Fields
|
10562.00
|
902.89
|
854.21
|
885.10
|
96.51
|
8912.15
|
8391.50
|
8870.89
|
94.60
|
|
Total
|
37367.00
|
3162.50
|
2976.41
|
3075.52
|
96.78
|
31315.10
|
29910.80
|
30120.86
|
99.30
|
Note: Totals may not tally due to rounding off. *: Provisional
Figure-1: Monthly Crude Oil Production

Unit-wise production details with reasons for shortfall are as under:
-
- Crude oil production by ONGC during January, 2018 was 1836.79 TMT which is 5.45% lower than the monthly target and 4.15% lower when compared with January, 2017. Cumulative crude oil production by ONGC during April-January, 2017-18 was 18685.49 TMT which is 3.05% lower than target for the period but 0.76% higher than production during corresponding period of last year. Reasons for shortfall in production with respect to target are as under:
- Delay in implementation of “Conversion of Sagar Samrat to MOPU” Project.
- Non realisation of Production planned from project “Integrated Development of B 127 Cluster” from Oct’2017 onwards due to delay in implementation of project.
- Repairing of gas leakage in 8” Gas lift line from NLP to NLM-8 well platform and 4" branches to NLM-6 & NLM-7 well platforms from 2nd – 28th January, 2018.
- Production from NBP field in western offshore affected due to ESP related issues.
- Rig is deployed at NBP-B and NBP-C well platforms for remedial measures.
- Increase in water cut in wells of Heera, Neelam, B-173 fields and Kesnapalli west field of Rajahmundry.
- Frequent power shutdowns & low gas injection pressure in Mehsana & Assam hampered Artificial Lift operations.
- Wells closed for cluster drilling/ rig movements in Assam.
-
- Crude oil production by OIL during January, 2018 was 285.40 TMT which is 9.98% lower than monthly target but 4.14% higher than production in January, 2017. Cumulative crude oil production by OIL during April-January, 2017-18 was 2833.82 TMT which is 9.46% lower than target for the period but 4.78% higher than production during the corresponding period of last year. Reasons for shortfall in production are as under:
- Less than planned contribution from old wells – Rise in water cut in wells and decline in total liquid production of wells of Greater Hapjan and Greater Chandmari Fields.
- Less than planned contribution from work over wells
-
- Crude oil production by Pvt/JVs during January, 2018 was 854.21 TMT which is 5.39% lower than the monthly target and 3.49% lower than January, 2017. Cumulative crude oil production by Pvt/JVs during April-January, 2017-18 was 8391.50 TMT which is 5.84% lower than target for the period and 5.40% lower than the production during the corresponding period of last year. Reasons for shortfall in production are as under:
- RJ-ON-90/1: 1) Mangala production lowered due to voltage dip on 26 Jan 2018 and power fluid pump maintenance on 31 Jan 2018. 2) No production from Guda for Jan 2018 due to non-availability of tankers. 3) Around 85 oil wells are closed due to various reasons like high water cut, require WOJ, etc. 4) Underperformance vis-à-vis MC approved profile in Bhagyam field. (CEIL)
- Full-fledged production from field is yet to be realized owing to delay in drilling of development wells as per plan in CY-ONN-2002/2. (ONGC)
- Production lower due to compressor unscheduled maintenance and closure of re-perforation wells and PC-14H underperformance in Panna-Mukta. (SHELL)
Natural Gas
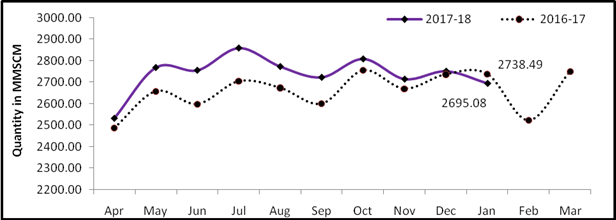
- Natural gas production during January, 2018 was 2695.08 MMSCM which is 11.55% lower than the target for the month and 1.59% lower when compared with January, 2017. Cumulative natural gas production during April-January, 2017-18 was 27382.63 MMSCM which is 6.13% lower than target for the period but 2.85% higher than the production during corresponding period of last year. Unit-wise and state-wise natural gas production is given at Annexure-II. Unit-wise natural gas production for the month of January, 2018 and cumulatively for the period April-January, 2017-18 vis-à-vis same period of last year has been shown in Table-2 and month-wise in Figure-2.
Table-2: Natural Gas Production (MMSCM)
|
Oil Company
|
Target
|
January (Month)
|
April-January (Cumulative)
|
|
2017-18 (Apr-Mar)
|
2017-18
|
2016-17
|
% over last year
|
2017-18
|
2016-17
|
% over last year
|
|
Target
|
Prod.*
|
Prod.
|
Target
|
Prod.*
|
Prod.
|
|
ONGC
|
24208.00
|
2125.25
|
1964.67
|
1922.27
|
102.21
|
20027.62
|
19615.84
|
18342.55
|
106.94
|
|
OIL
|
3000.00
|
247.51
|
238.46
|
248.79
|
95.85
|
2507.18
|
2435.44
|
2460.35
|
98.99
|
|
PSC Fields
|
8034.00
|
674.35
|
491.95
|
567.43
|
86.70
|
6636.68
|
5331.35
|
5820.97
|
91.59
|
|
Total
|
35242.00
|
3047.10
|
2695.08
|
2738.49
|
98.41
|
29171.48
|
27382.63
|
26623.88
|
102.85
|
Note: Totals may not tally due to rounding off. *: Provisional
Figure-2: Monthly Natural Gas Production

-
- Natural gas production by ONGC during January, 2018 was 1964.67 MMSCM which is 7.56% lower than the monthly target but 2.21% higher when compared with January, 2017. Cumulative natural gas production by ONGC during April-January, 2017-18 was 19615.84 MMSCM which is 2.06% lower than the cumulative target but 6.94% higher than the production during the corresponding period of the last year. Reasons for shortfall in production during month are as under:
Ø Less gas production from WO16 cluster and no production from B127 Cluster due to delay in implementation of “Conversion of Sagar Samrat to MOPU” and “Integrated Development of B 127 Cluster” Project respectively.
Ø BPB Process Platform Shutdown taken from 24th -31st January, 2018 for carrying out repair jobs related to HP flare line at BPB Complex under pipeline tender of Integrated Development of B127 Project.
Ø Delay in commencement of production planned from sub-sea wells in Eastern Offshore. Production is expected to commence from these wells from end of Feb’2018.
-
- Natural gas production by OIL during January, 2018 was 238.46 MMSCM which is 3.66% lower than the monthly target and 4.15% lower than January, 2017. Cumulative natural gas production by OIL during April-January, 2017-18 was 2435.44 MMSCM which is 2.86% lower than the cumulative target and 1.01% lower than the production during the corresponding period of last year. Reasons for shortfall in production are as under:
Ø Shutdown of LTPS from 03.01.2018 for carrying our hydro test of the gas supply line.
Ø BVFCL Namrup-II plant under maintenance for CO2 compressor problem.
Ø Unscheduled maintenance shutdown of plants of major customers.
-
- Natural gas production by Pvt/JVs during January, 2018 was 491.95 MMSCM which is 27.05% lower than the monthly target and 13.30% lower when compared with January, 2017. Cumulative natural gas production by Pvt/JVs during April-January, 2017-18 was 5331.35 MMSCM which is 19.67% lower than the cumulative target and 8.41% lower than the production during the corresponding period of last year. Reasons for shortfall in production are as under:
- Underperformance of KG-OSN-2001/3. (ONGC)
- KG-DWN-98/3: Well A5 ceased on 24.01.2018 due to high water production. (RIL)
- Raniganj East CBM block: Some wells closed for planned maintenance and refrac jobs. Major customer 'Matix' under operational shutdown (ESSAR).
- Sohagpur West CBM Block: Underperformance of CBM wells. Planned temporary shutdown in Jan’18 to complete the installation of the Mercury Removal Unit (MRU) at Shahdol. (RIL)
- RJ-ON/6: Consumer plant shut-down for yearly maintenance. (FEL)
- Panna-Mukta: Production lower due to compressor unscheduled maintenance and closure of re-perforation wells and PC-14H underperformance. (SHELL)
- Refinery Production (in terms of crude oil processed)
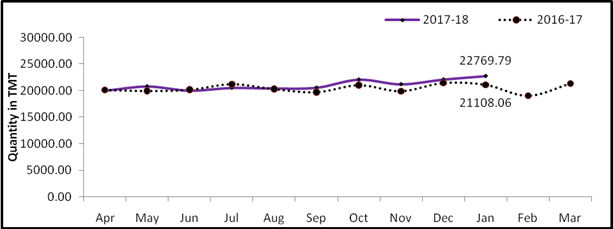
Refinery production during January, 2018 was 22769.79 TMT which is 3.89% higher than the target for the month and 7.87% higher when compared with January, 2017. Cumulative production during April-January, 2017-18 was 210733.65 TMT which is 3.35% higher than the target for the period and 2.80% higher than the production during corresponding period of last year. Unit-wise production is given at Annexure-III. Company-wise production for the month of January, 2018 and cumulatively for the period April-January, 2017-18 vis-à-vis same period of last year has been shown in Table-3 and month-wise in Figure-3.
Table 3: Refinery Production (TMT)
|
Oil Company
|
Target
|
January (Month)
|
April-January (Cumulative)
|
|
2017-18 (Apr-Mar)
|
2017-18
|
2016-17
|
% over last year
|
2017-18
|
2016-17
|
% over last year
|
|
Target
|
Prod.*
|
Prod.
|
Target
|
Prod.*
|
Prod.
|
|
CPSE
|
140322
|
12716.03
|
13160.93
|
11760.82
|
111.90
|
115906.51
|
121220.36
|
114521.67
|
105.85
|
|
IOCL
|
66290
|
6062.23
|
6208.92
|
5470.07
|
113.51
|
54561.41
|
58057.88
|
53574.03
|
108.37
|
|
BPCL
|
27000
|
2475.00
|
2677.78
|
2197.16
|
121.87
|
22200.00
|
23118.89
|
21536.14
|
107.35
|
|
HPCL
|
18000
|
1554.27
|
1571.21
|
1572.11
|
99.94
|
15101.91
|
15217.43
|
14767.94
|
103.04
|
|
CPCL
|
10300
|
942.47
|
970.22
|
861.78
|
112.58
|
8509.18
|
8946.37
|
9032.18
|
99.05
|
|
NRL
|
2670
|
226.65
|
250.70
|
282.93
|
88.61
|
2238.03
|
2385.84
|
2243.50
|
106.34
|
|
MRPL
|
16000
|
1450.00
|
1475.36
|
1369.06
|
107.76
|
13245.00
|
13427.09
|
13296.67
|
100.98
|
|
ONGC
|
62
|
5.41
|
6.74
|
7.70
|
87.50
|
50.98
|
66.86
|
71.22
|
93.88
|
|
JVs
|
15201
|
1468.00
|
1615.36
|
1519.98
|
106.28
|
12356.00
|
12557.81
|
14217.87
|
88.32
|
|
BORL
|
6000
|
525.00
|
600.20
|
582.81
|
102.98
|
4950.00
|
5638.02
|
5260.73
|
107.17
|
|
HMEL
|
9201
|
943.00
|
1015.17
|
937.17
|
108.32
|
7406.00
|
6919.80
|
8957.14
|
77.25
|
|
Private
|
90480
|
7732.91
|
7993.50
|
7827.26
|
102.12
|
75647.28
|
76955.48
|
76259.62
|
100.91
|
|
RIL
|
70174
|
6055.06
|
6223.23
|
6055.06
|
102.78
|
58696.89
|
59642.20
|
58696.89
|
101.61
|
|
EOL
|
20306
|
1677.85
|
1770.27
|
1772.19
|
99.89
|
16950.39
|
17313.28
|
17562.73
|
98.58
|
|
TOTAL
|
246002
|
21916.94
|
22769.79
|
21108.06
|
107.87
|
203909.78
|
210733.65
|
204999.17
|
102.80
|
Note: Totals may not tally due to rounding off. *: Provisional
Figure 3: Monthly Refinery Production

-
- CPSE Refineries’ production during January, 2018 was 13160.93 TMT which is 3.5% higher than the target for the month and 11.9% when compared with January, 2017. Cumulative production by CPSE refineries during April-January, 2017-18 was 121220.34 TMT which is 4.58% higher than the target for the period and 5.16% higher than the production during corresponding period of last year.
3.2 Production in JV refineries during January, 2018 was 1615.36 TMT which is 10.04% higher than the target for the month and 6.28% higher when compared with January, 2017. Cumulative production by JVs refineries during April-January, 2017-18 was 12557.81 TMT which is 1.63% lower than the target for the period but 11.68% lower than the production during corresponding period of last year.
3.3 Production in private refineries during January, 2018 was 7993.50 TMT which is higher 3.37% than the target for the month and 2.12% higher when compared with January, 2017. Cumulative production by private refineries during April-January, 2017-18 was 76955.48 TMT which is 1.73% higher than the target for the period and marginally higher by 0.91% than the production during corresponding period of last year.
3.4 Refinery-wise details of the capacity utilization and production of petroleum products during the month of January, 2018 and cumulatively for the period April-January, 2017-18 vis-à-vis April-January, 2016-17 are given at Annexures - IV and V respectively.
Click here for Annexures I:
Click here for Annexures II:
Click here for Annexures III:
Click here for Annexures IV:
Click here for Annexures V:
********
AD
(Release ID :176706)