1. Crude Oil
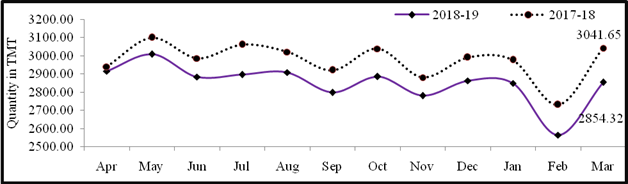
Crude oil production[1] during March, 2019 was 2854.32TMT which is12.99 % lower than target and6.16% lower when compared with March, 2018.Cumulative crude oil production during April-March, 2018-19 was 34203.27 TMT which is 7.59% and 4.15% lower than the cumulative target and production respectively during the corresponding period of last year.Unit-wise and State-wise crude oil production is given at Annexure-I. Unit-wise crude oil production for the month of March, 2019 and cumulatively for the period April-March, 2018-19 vis-à-vis same period of last year has been shown in Table-1 and month-wise in Figure-1.
Table-1: Crude Oil Production (in TMT)
|
Oil Company
|
Target
|
March(Month)
|
April-March (Cumulative)
|
|
2018-19 (Apr-Mar)
|
2018-19
|
2017-18
|
% over last year
|
2018-19
|
2017-18
|
% over last year
|
|
Target
|
Prod.*
|
Prod.
|
Target
|
Prod.*
|
Prod.
|
|
ONGC
|
23040.00
|
2066.46
|
1768.17
|
1879.17
|
94.09
|
23040.00
|
21042.11
|
22249.12
|
94.58
|
|
OIL
|
3738.00
|
340.94
|
278.10
|
281.52
|
98.78
|
3738.00
|
3293.13
|
3376.28
|
97.54
|
|
PSC Fields
|
10233.60
|
872.91
|
808.04
|
880.96
|
91.72
|
10233.60
|
9868.02
|
10058.94
|
98.10
|
|
Total
|
37011.60
|
3280.32
|
2854.32
|
3041.65
|
93.84
|
37011.60
|
34203.27
|
35684.33
|
95.85
|
Note: Totals may not tally due to rounding off. *: Provisional
Figure-1: Monthly Crude Oil Production
Unit-wise production details with reasons for shortfall are as under:
1.1 Crude oil production by ONGC during March, 2019 was 1768.17 TMT which is 14.43%lower than the monthly target and5.91%lower when compared with March, 2018. Cumulative crude oil production by ONGC during April-March, 2018-19 was 21042.11TMT which is 8.67% and 5.42% lower than the cumulative target and production respectively during the corresponding period oflast year.Reasons for shortfall are as under:
Ø Electric submersible pump (ESP) problem in some wells of NBP field.
Ø Loss from WO-16 fields in the absence of MOPU Sagar Samrat.
Ø Sub-sea leakage in some well fluid lines of Mumbai High & Neelam Heera Asset, leading to flow restriction.
Ø Less than envisaged production due to reduced EOR effect in Santhal and Balol fields in Mehsana. Air injection rates under optimization.
Ø Less than planned realisation from development wells in Geleki & Demualgaon fields in Assam Asset.
1.2 Crude oil production by OIL during March, 2019 was278.10 TMT which is 18.43%lower than monthly target and 1.22% lower when compared with March, 2018. Cumulative crude oil production by OIL during April-March, 2018-19 was 3293.13 TMT which is 11.90% and 2.46% lower than the cumulative target and production respectively during the corresponding period of last year.Reasons for shortfall are as under:
Ø Loss from bandh and miscreant activities in operational areas.
Ø Less than planned contribution from work over well and drilling wells.
1.3 Crude oil production byPvt/JVsin PSC regime during March, 2019 was 808.04 TMT which is 7.43% lower than the monthly target and8.28%lowerthanMarch, 2018.Cumulative crude oil production by Pvt/JVs during April-March, 2018-19 was 9868.02 TMT which is 3.57 % and 1.90% lower than the cumulative target and production respectively during the corresponding period of last year.Major reasonsin for lower production are;
Ø Loss from Mangala due to delay in upgrade of Mangala Processing Terminal (MPT) and delay in drilling, completion and hooking up online 45 infill wells(CEIL).
Ø Lower yield from NE development drilling campaign due to geological uncertainties (CEIL).
Ø Closure of around 100 oil wells due to various reasons like liquid handling constraint at MPT plant, pump failure, surface facility limitation, etc(CEIL).
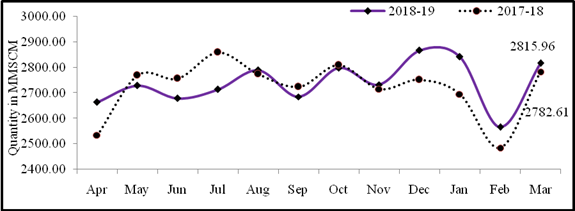
2.Natural Gas
Natural gas production during March, 2019 was 2815.96 MMSCM which is 1.20% higher when compared with March, 2018 although 8.99% lower than the target for the month. Cumulative natural gas production during April-March, 2018-19 was 32873.37MMSCM which is marginally higher by0.69% when compared with the production during corresponding period of last year, however is lowerby 7.66% than target for the period.Unit-wise and state-wise natural gas production is given at Annexure-II. Unit-wise natural gas production for the month of March, 2019 and cumulatively for the period April-March, 2018-19vis-à-vis same period of last year has been shown in Table-2 and month-wise in Figure-2.
Table-2: Natural Gas Production (MMSCM)
|
Oil Company
|
Target
|
March (Month)
|
April-March (Cumulative)
|
|
2018-19 (Apr-Mar)
|
2018-19
|
2017-18
|
% over last year
|
2018-19
|
2017-18
|
% over last year
|
|
Target
|
Prod.*
|
Prod.
|
Target
|
Prod.*
|
Prod.
|
|
ONGC
|
25981.00
|
2236.50
|
2134.89
|
2013.61
|
106.02
|
25981.00
|
24674.65
|
23429.47
|
105.31
|
|
OIL
|
3120.06
|
260.62
|
235.12
|
236.73
|
99.32
|
3120.06
|
2721.90
|
2881.50
|
94.46
|
|
PSC Fields
|
6498.11
|
596.91
|
445.95
|
532.28
|
83.78
|
6498.11
|
5476.82
|
6338.34
|
86.41
|
|
Total
|
35599.17
|
3094.03
|
2815.96
|
2782.61
|
101.20
|
35599.17
|
32873.37
|
32649.31
|
100.69
|
Note: Totals may not tally due to rounding off. *: Provisional
Figure-2: Monthly Natural Gas Production
2.1 Natural gas production by ONGC during March, 2019 was 2134.89 MMSCM which is 6.02% higher when compared with March, 2018 although 4.54% lower than the target for the month.
Cumulative natural gas production by ONGC during April-March, 2018-19 was 24674.65 MMSCM which is 5.31% higher than the production during the corresponding period of the last year but 5.03% lower than the cumulative target. Some of the reasons for lower production viz monthly target is decline in pressure/potential in GS-4 Gas cap reservoir in Gandhar field.
2.2 Natural gas production by OIL during March, 2019 was 235.12MMSCM which is 9.79% lower than the monthly targetand0.68% lower than March, 2018. Cumulative natural gas production by OIL during April-March, 2018-19 was 2721.90 MMSCM which is 12.76% and 5.54% lower than the cumulative target and production respectively during the corresponding period of last year. Reasons for shortfall are as under:
Ø Loss of potential in Deohal area due to presence of CO2 in production stream.
Ø Loss from bandh and miscreant activities in operational areas.
2.3 Natural gas production by Pvt/JVs during March, 2019 was 445.95 MMSCM which is 25.29% lower than the monthly target and 16.22 %lower when compared with March, 2018. Cumulative natural gas production by Pvt/JVs during April-March, 2018-19 was 5476.82MMSCM which is 15.72% lower than the cumulative target and13.59%lower than the production during the corresponding period of last year. Reasons for shortfall in production are as under:
Ø Sohagpur West CBM Block: Increase in number of wells requiring workover due to sanding, scaling and resultant pump replacement requirement etc. 36 development wells which are still under dewatering phase and gas breakout is yet to be seen. (RIL)
Ø Closure of 2 wells in D1D3 field.
Ø Loss from Mangala due to delay in upgrade of Mangala Processing Terminal (MPT) and delay in drilling, completion and hooking up online 45 infill wells and lower inputs from NE development drilling campaign (CEIL).
3. Refinery Production (in terms of crude oil processed)
Refinery production during March, 2019 was 22495.43TMT which is higher 6.51%when compared with March, 2018 and8.18%higherthan the target for the month. Cumulative production during April-March, 2018-19 was 257204.86 TMT which is 1.30% and 2.09% higher than the cumulative target and production respectively during the corresponding period of last year. Unit-wise production is given at Annexure-III. Company-wise production for the month of March, 2019 and cumulatively for the period April-March, 2018-19 vis-à-vis same period of last year has been shown in Table-3 and month-wise in Figure-3.
Figure 3: Monthly Refinery Production
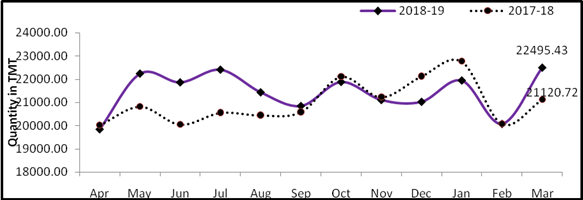
Table 3: Refinery Production (TMT)
|
Oil Company
|
Target
|
March (Month)
|
April-March (Cumulative)
|
|
2018-19 (Apr-Mar)
|
2018-19
|
2017-18
|
% over last year
|
2018-19
|
2017-18
|
% over last year
|
|
Target
|
Prod.*
|
Prod.
|
Target
|
Prod.*
|
Prod.
|
|
CPSE
|
147759
|
12220.90
|
12753.95
|
12526.86
|
101.81
|
147759.38
|
150975.66
|
145233.78
|
103.95
|
|
IOCL
|
71150
|
5641.85
|
5659.69
|
5596.81
|
101.12
|
71149.92
|
71815.86
|
69001.16
|
104.08
|
|
BPCL
|
29000
|
2478.24
|
2793.05
|
2664.19
|
104.84
|
29000.00
|
30823.44
|
28148.65
|
109.50
|
|
HPCL
|
18000
|
1553.57
|
1627.30
|
1590.60
|
102.31
|
18000.46
|
18444.07
|
18276.18
|
100.92
|
|
CPCL
|
10500
|
850.00
|
1003.88
|
981.97
|
102.23
|
10500.00
|
10694.70
|
10789.01
|
99.13
|
|
NRL
|
2850
|
242.05
|
246.10
|
217.34
|
113.23
|
2850.00
|
2900.39
|
2809.43
|
103.24
|
|
MRPL
|
16200
|
1450.00
|
1416.01
|
1469.45
|
96.36
|
16200.00
|
16231.05
|
16129.77
|
100.63
|
|
ONGC
|
59
|
5.18
|
7.93
|
6.50
|
122.03
|
59.00
|
66.16
|
79.58
|
83.13
|
|
JVs
|
17240
|
1583.00
|
1797.56
|
1534.05
|
117.18
|
17240.00
|
18188.69
|
15538.10
|
117.06
|
|
BORL
|
6400
|
660.00
|
702.78
|
569.16
|
123.48
|
6400.00
|
5715.88
|
6707.90
|
85.21
|
|
HMEL
|
10840
|
923.00
|
1094.78
|
964.88
|
113.46
|
10840.00
|
12472.80
|
8830.20
|
141.25
|
|
Private
|
88896
|
6990.52
|
7943.93
|
7059.82
|
112.52
|
88896.05
|
88040.52
|
91162.93
|
96.57
|
|
RIL
|
70470
|
5274.52
|
6153.91
|
5274.52
|
116.67
|
70470.05
|
69145.00
|
70470.05
|
98.12
|
|
NEL
|
18426
|
1716.00
|
1790.01
|
1785.29
|
100.26
|
18426.00
|
18895.52
|
20692.88
|
91.31
|
|
TOTAL
|
253895
|
20794.42
|
22495.43
|
21120.72
|
106.51
|
253895.43
|
257204.86
|
251934.80
|
102.09
|
Note: Totals may not tally due to rounding off. *: Provisional
3.1 CPSE Refineries’ production during March, 2019 was 12753.95TMT which is 4.36%higher than the monthly targetand1.81%higher when compared with March, 2018.Cumulative production by CPSE refineries during April-March, 2018-19 was 150975.66 TMT which is 2.18% and 3.95% higher than the cumulative target and production respectively during the corresponding period of last year. Reasons for shortfall of refinery production in some CPSE refineries are as under:
Ø IOCL-Guwahati: Lower due to high RCO stocks due to Delayed coker Unit(DCU)& Indmax Unit shutdown.
Ø IOCL-Gujarat: Lower due to M&I shut down.
Ø MRPL: Limitation in CDU III unit ejector-condensor.
3.2 Production in JV refineries during March, 2019 was 1797.56TMT which is 13.55% higher than the target for the month and17.18% higherwhen compared with March, 2018.Cumulative production by JVs refineries during April-March, 2018-19 was 18188.69TMT which is 5.50% and 17.06% higher than the cumulative target and production respectively during the corresponding period of last year.
3.3 Production in private refineries during March, 2019 was 7943.93TMT which is higherby 13.64% than the target for the month and12.52% higherwhen compared with March, 2018. Cumulative production by private refineries during April-March, 2018-19 was 88040.52 TMT which is 0.96% and 3.43% lower than the cumulative target and production respectively during the corresponding period of last year.
3.4 Refinery-wise details of the capacity utilization and production of petroleum products during the month of March, 2019 and cumulatively for the period April-March, 2018-19vis-à-vis April-March, 2017-18 are given at Annexures -IV and V respectively.
Click here to see Annexure-I
Click here to see Annexure-II
Click here to see Annexure-III
Click here to see Annexure-IV
Click here to see Annexure-V
YB